LunarWeave
Japan’s 3% Yield Is A Cheap-Debt Problem, Not A 2025 Blowout
Japan’s 10-year government bond yield touched 3 percent on 1 September 2026, the first time a benchmark long-term rate had been that high since October 1996, according to Jiji Press. Traders blamed oil-driven inflation, a global bond sell-off, and Prime Minister Sanae Takaichi’s expansionary budget. U.S. Treasury Secretary Scott Bessent, in a Reuters report the same day, called time on Japan’s big-stimulus era.
The scare is easy to tell: the most indebted G7 government is being asked to pay a rate it has not seen in 30 years. The IMF World Economic Outlook accounts tell a different story about this year’s budget. Japan’s COVID-era deficit had already almost closed. Its interest bill, measured as the gap between the Fund’s primary and overall balances, was still a rounding error beside the United States and Italy. What has changed is the price of rolling that debt, not a 2025 explosion in the stock.
The last 3% yield was a different country
In 1996, the IMF’s average consumer-price inflation for Japan was 0.14 percent. Gross government debt was 85.3 percent of GDP. The residual between the primary and overall balances — a stand-in for net interest in the Fund’s books, not a market yield — was 1.17 percent of GDP.
In 2025, those same series show inflation at 3.17 percent, gross debt at 206.5 percent of GDP, and residual net interest at 0.20 percent of GDP. If the reported 3 percent 10-year yield holds, it is arriving with roughly 3 percent inflation, not with the near-zero prices of 1996. The headline rate rhymes. The real rate and the debt stock do not.
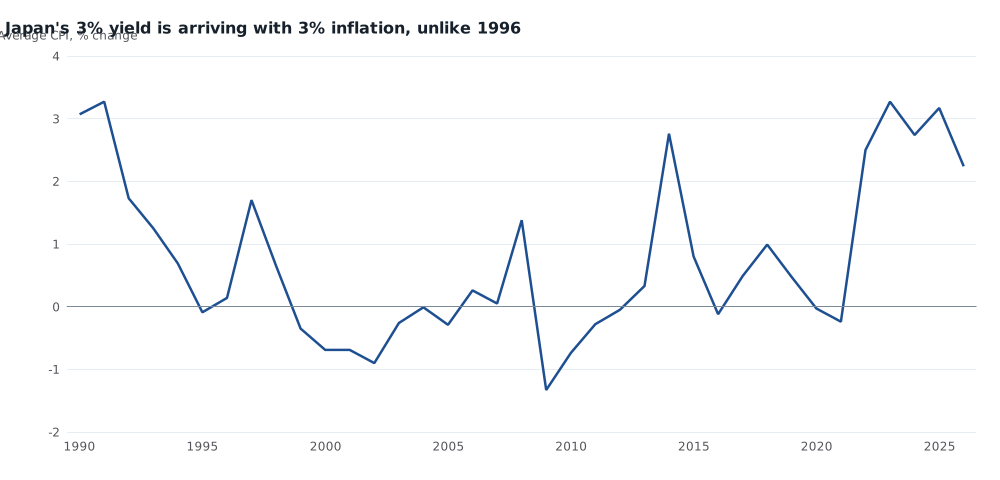
Japan average consumer-price inflation, percent change, 1990–2026. 2025–26 are IMF estimates and projections in the 24 August 2026 WEO snapshot, not monthly prints. Source: IMF World Economic Outlook.
The debt ratio peaked in 2020. The interest bill never followed it up.
Japan’s gross debt ratio jumped during the pandemic, to 228.8 percent of GDP in 2020, and has since come down to 206.5 percent in 2025. That is still the highest ratio in the G7 by a wide margin — Italy is at 137.1 percent, the United States at 123.9 percent — but it is not a ratio that is still exploding.
Net debt is lower, at 136.5 percent of GDP in 2025, because the Japanese state holds large financial assets. Even that figure is high. What is not high is the carrying cost.
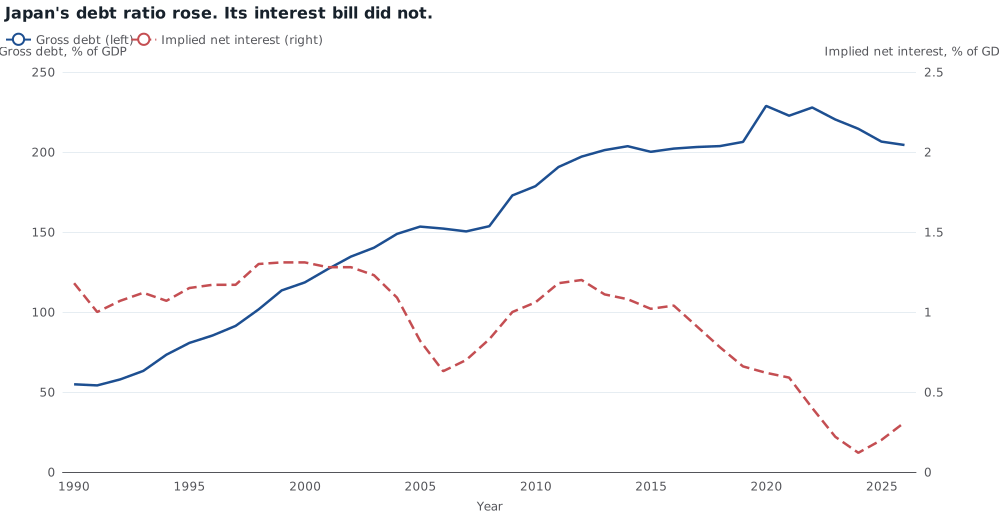
Japan general-government gross debt (left) and implied net interest (right), percent of GDP, 1990–2026. Implied net interest is the IMF primary balance minus the overall balance; it is not the 10-year market yield. 2025–26 are estimates/projections. Source: IMF World Economic Outlook.
In 2025 that residual was 0.20 percent of GDP in Japan, 3.65 percent in the United States, and 3.61 percent in Italy. Japan’s debt ratio is about two-thirds larger than America’s. Its residual interest bill is about one-eighteenth as large. Dividing the residual by the gross-debt ratio implies an effective rate near 0.1 percent on the Japanese stock, against about 2.9 percent in the United States. Those are accounting residuals, not quoted bond yields, and they can even turn slightly negative — as in Canada — when a government is a net interest recipient. They are still the right scale comparison: Tokyo has been servicing a 200-percent-of-GDP debt pile at near-zero cost.
| 2025 (IMF estimates) | Gross debt, % of GDP | Overall balance, % of GDP | Implied net interest, % of GDP | Average CPI inflation, % |
|---|---|---|---|---|
| Japan | 206.5 | −1.05 | 0.20 | 3.17 |
| United States | 123.9 | −6.82 | 3.65 | 2.73 |
| Italy | 137.1 | −3.11 | 3.61 | 1.63 |
| France | 116.0 | −5.11 | 1.98 | 0.93 |
| United Kingdom | 102.3 | −5.38 | 2.61 | 3.37 |
| Canada | 113.5 | −1.77 | −0.33 | 2.08 |
| Germany | 62.9 | −2.67 | 0.88 | 2.30 |
Implied net interest is the primary minus overall general-government balance. Canada’s small negative residual is possible when the government earns more interest than it pays; it is not a market rate. Source: IMF WEO, 24 August 2026 snapshot.
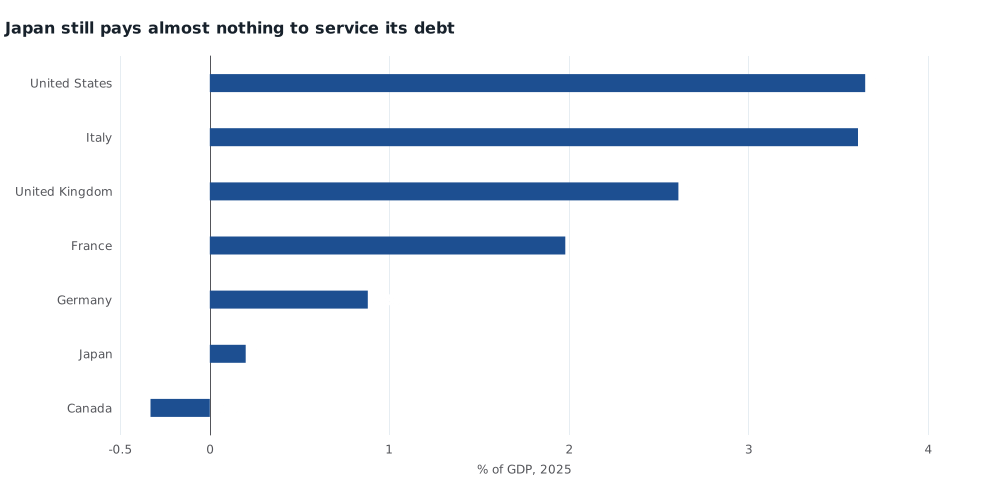
Implied net interest, percent of GDP, 2025. Same residual definition as the table. Source: IMF World Economic Outlook.
That is why a 3 percent market yield is a genuine regime change even if it is not a 2025 crisis print. A 3 percent coupon on the whole 2025 gross-debt stock would be 6.2 percent of GDP — larger than the United States’ entire residual interest bill, and more than Japan’s overall deficit in the worst pandemic year. Existing bonds do not reprice overnight. The IMF’s own projections have the residual rising only to 0.31 percent of GDP in 2026 and 1.49 percent by 2030. The danger is the path of new coupons, not an arithmetic identity that the entire stock now yields 3 percent.
The stimulus binge is already in the rear-view mirror
Bessent’s lecture is aimed at a Japan that, in the IMF books, has already put the COVID spending spike away. General-government expenditure was 43.6 percent of GDP in 2020. By 2025 it was 36.9 percent, almost back to 36.4 percent in 2019. Revenue rose from 33.4 percent of GDP to 35.8 percent over the same span.
The overall budget balance moved from −9.04 percent of GDP in 2020 to −1.05 percent in 2025. The primary balance, which excludes interest, was −0.85 percent of GDP — close to zero, not a wartime-style gap. The Fund then projects the overall deficit to widen again, to 2.05 percent of GDP in 2026. That is a policy risk, not a description of last year’s outturn.
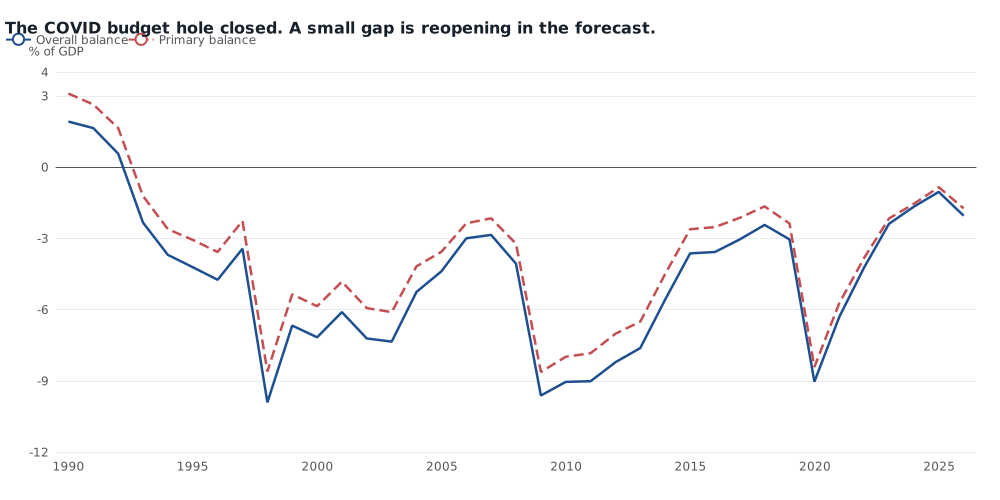
Japan general-government overall and primary balances, percent of GDP, 1990–2026. Negative is a deficit. 2025–26 are IMF estimates/projections. Source: IMF World Economic Outlook.
Reported budget-request headlines in the trillions of yen are a different object. Jiji said fiscal 2027 general-account requests were believed to have exceeded 143 trillion yen; another same-day wire put a similar figure on fiscal 2026. Either way, that is a central-government request, not the IMF’s general-government spending total, which was already 244.6 trillion yen in 2025 against GDP of 663.8 trillion yen. The two numbers should not be stacked.
Japan also still runs a current-account surplus — 4.83 percent of GDP in 2025, against a 3.63 percent U.S. deficit. The bond market can demand a higher yen yield without that being a sudden-stop story. Real growth in the same accounts is weak, at 1.2 percent in 2025 and a 0.7 percent projection for 2026, so the country is not growing its way out of the debt stock. It does not need to, as long as the coupons stay tiny. That is the part that 3 percent threatens.
The 1 September print is a warning about the cost of future Japanese debt, not a snapshot of a government that was already paying Italian interest on a Japanese stock. The cheap-debt era can end without the 2025 deficit having been the problem.
Methods and sources
This is retrospective research completed on 10 September 2026, using a pinned IMF World Economic Outlook snapshot dated 24 August 2026, not an as-of reconstruction of what was knowable on 1 September. Digest date: 1 September 2026. Annual 2025 figures in this snapshot are IMF estimates; 2026–31 are staff projections. They are not the September 2026 10-year yield, which is a reported market print and is not in the catalogue.
Fiscal series are general government, percent of GDP, identified by official WEO codes: gross debt GGXWDG_NGDP, overall net lending/borrowing GGXCNL_NGDP, primary net lending/borrowing GGXONLB_NGDP. Implied net interest is the primary minus overall balance. Catalogue display names for the primary and structural-balance series are swapped; this article follows the codes. MacroVedia pages are multi-country; select Japan in the chart. Browser layout was not separately tested beyond SVG rendering.
Research Date
The displayed date matches the related news edition. Research was completed 2026-09-10.
Related news: Daily · 2026-09-01
More Research
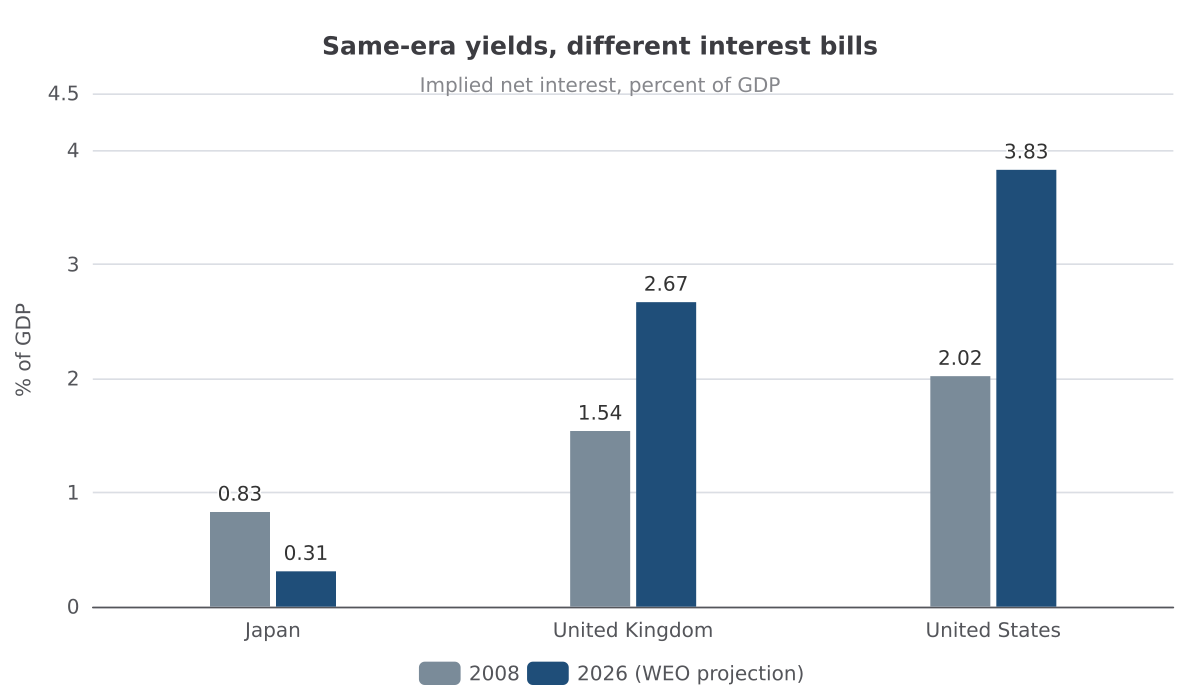
Japan’s 30-Year-High Yield Is Not This Year’s Interest Bill
Japan’s 3% 10-year yield is a 30-year high, but IMF accounts still show Tokyo paying almost no net interest. Britain’s 2008-level gilt yield is already an interest bill, because the debt sto
Nepal’s Power System Is Hydropower — And It Was Still Being Built
IRENA accounts show Nepal already generates almost all of its electricity from hydropower, and on-grid hydro capacity more than tripled from 2020 to 2025 — the construction boom sitting unde
The Border Surge Ended In February. The Asylum Crackdown Did Not.
Title 8 southwest-border encounters collapsed in February 2025 and stayed near 11,000 a month through mid-2026, long before the reported June asylum-denial spike.