LunarWeave
Japan’s 30-Year-High Yield Is Not This Year’s Interest Bill
On 2 September 2026, Japan’s 10-year government bond yield briefly printed 3.015 percent, a 30-year high, Jiji Press reported. The same morning, UK 10-year gilts traded just below 5.3 percent, a level last seen in mid-2008, as oil jumped on renewed US–Iran fighting. The market story was simple: war, fuel, inflation, and a sudden repricing of government debt.
The fiscal story is not. A 10-year yield is the price of new long-term borrowing. What governments actually pay this year is the average rate on a stock of bonds issued over decades, minus the interest they earn on their own financial assets. In the IMF’s World Economic Outlook accounts, Japan is still barely paying net interest even though it carries the heaviest debt load of the three. Britain, whose headline yield has returned to 2008, is already paying more of its economy in interest than it did then — because the debt stock doubled.
The bill that is already in the books
The IMF does not publish a standalone “interest bill” series in this dataset. It does publish general-government net lending/borrowing and primary net lending/borrowing (IMF code GGXONLB_NGDP). The gap between them is net interest: what the government pays on its debts, less what it receives on its assets, as a share of GDP.
That identity, applied to the Fund’s 2026 projections, is stark.
| Gross debt, 2008 | Gross debt, 2026 | Net interest, 2008 | Net interest, 2026 | |
|---|---|---|---|---|
| Japan | 154 | 204 | 0.83 | 0.31 |
| United Kingdom | 50.6 | 103.6 | 1.54 | 2.67 |
| United States | 73.8 | 125.8 | 2.02 | 3.83 |
Figures are percent of GDP. 2026 values are IMF projections in an August 2026 snapshot. Net interest is primary minus overall balance.
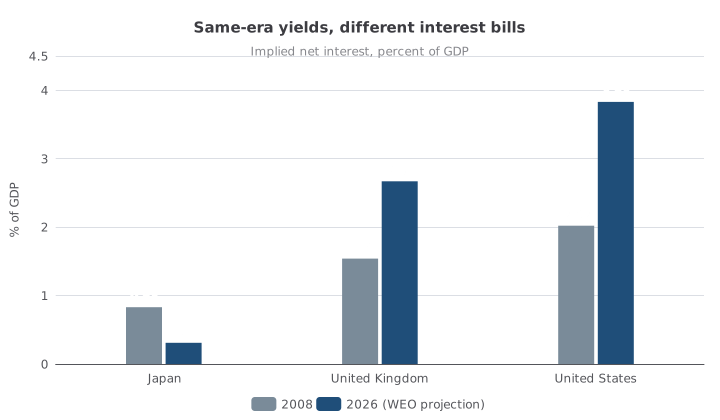
Implied general-government net interest, percent of GDP. 2008 is an outturn; 2026 is an IMF projection taken before the 2 September market move. This is net interest, not the 10-year yield. Source: IMF World Economic Outlook.
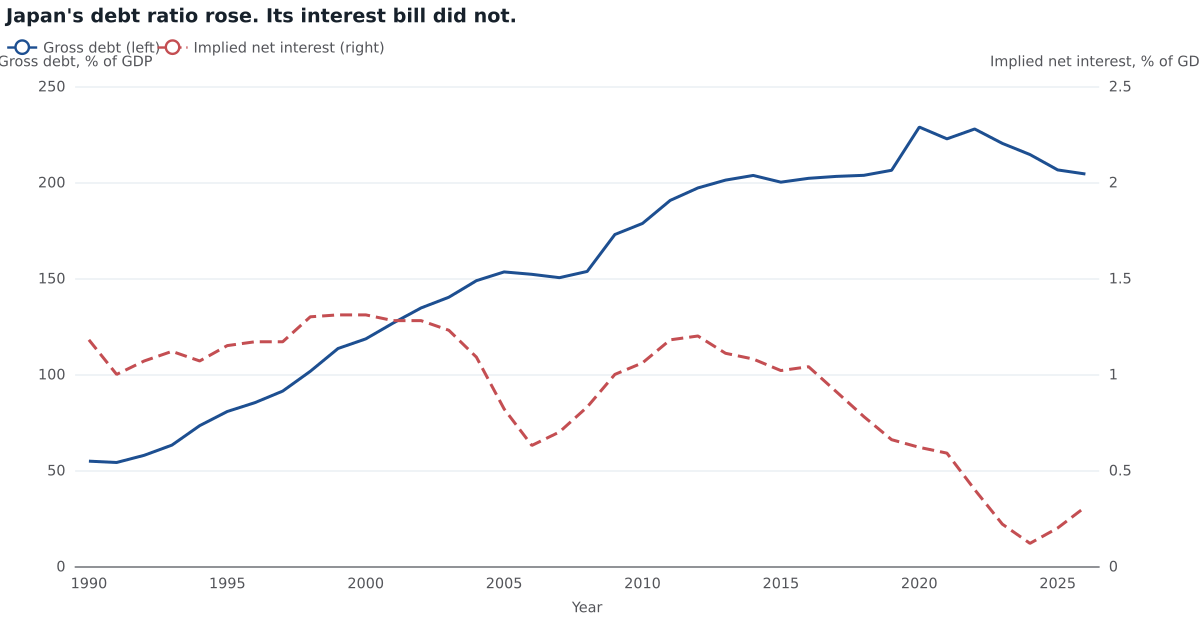
Japan’s 2026 interest bill is 0.31 percent of GDP — lower than in 2008, and only a little above the 0.12 percent recorded for 2024, the lowest year in this 1990–2026 window. Divide that 0.31 percent by Japan’s gross debt of 204 percent of GDP and the implied average rate on the whole stock is about 0.15 percent. The 3 percent yield in the Tokyo pit is twenty times that average.
Britain is already in a different regime. Gross debt was 50.6 percent of GDP in 2008 and 103.6 percent in the 2026 projection — 2.05 times as large. Implied net interest rose from 1.54 percent of GDP to 2.67 percent. The average rate on that larger stock is lower than in 2008 (2.6 percent versus 3.1 percent). The extra point of GDP in interest is the doubled debt, not a return to 2008 coupons.
The United States sits higher still. The Fund’s 2026 projection puts US gross debt at 126 percent of GDP and implied net interest at 3.83 percent of GDP — more than Britain, on a larger stock, at an average rate of about 3.0 percent. Of a 7.5 percent-of-GDP headline deficit, about half is already interest.
A 3 percent Japan is a future problem
None of this makes the Tokyo print harmless. It makes it a rollover problem rather than a current-year problem.
If Japan’s entire 204 percent-of-GDP gross stock paid an average rate equal to the reported 3.015 percent 10-year yield, net interest would be about 6.2 percent of GDP — twenty times the Fund’s 2026 implied bill, and larger than Britain’s whole projected deficit. That is a mechanical illustration, not a forecast. Bonds do not all mature on one morning. The Bank of Japan still holds a large share of the stock, and Japan’s net debt (134 percent of GDP in 2026) is much smaller than the headline gross figure because the government also owns financial assets. Those assets are why net interest can be a rounding error on a 200-percent debt ratio.
They are also why 3 percent still matters. Every new bond issued, and every old bond refinanced, at the higher yield raises the average. The IMF’s own path already has Japan’s net-interest ratio ticking up from 0.12 percent of GDP in 2024 to 0.31 percent in 2026 — a small rise from a tiny base. A 30-year high in the 10-year is how that rise could stop being small.
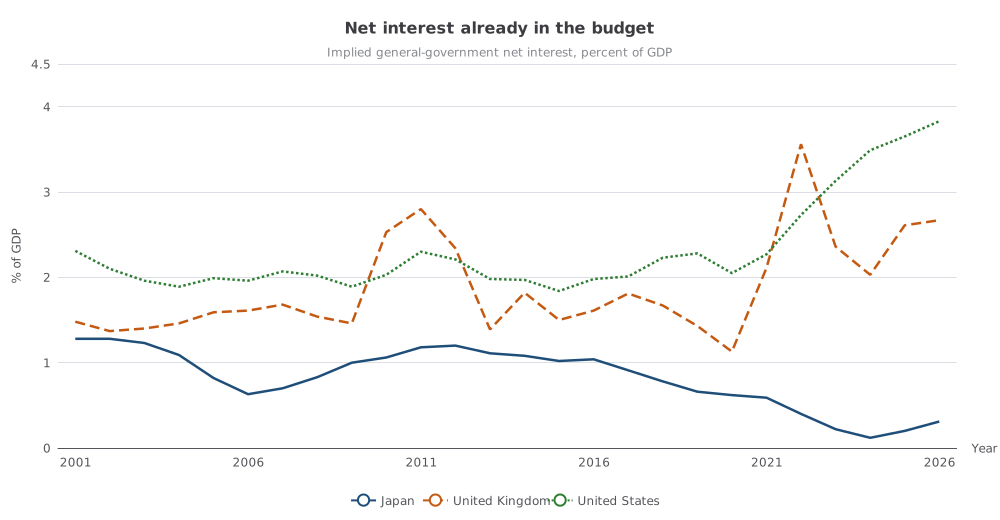
Implied net interest, percent of GDP, 2001–2026. 2025–26 are WEO projections. Japan stays under 1 percent of GDP throughout; Britain’s bill jumped in 2022 and remains above its 2008 level; the US bill is the highest of the three. Source: IMF WEO.
Britain has already lived a version of that repricing. Its implied interest bill peaked at 3.56 percent of GDP in 2022, when consumer-price inflation averaged 9.1 percent, then eased. The 2026 projection (2.67 percent of GDP) is below that spike and still well above 2008. A gilt yield back at 5.3 percent does not recreate 2008, because the denominator — the debt — is no longer 2008’s.
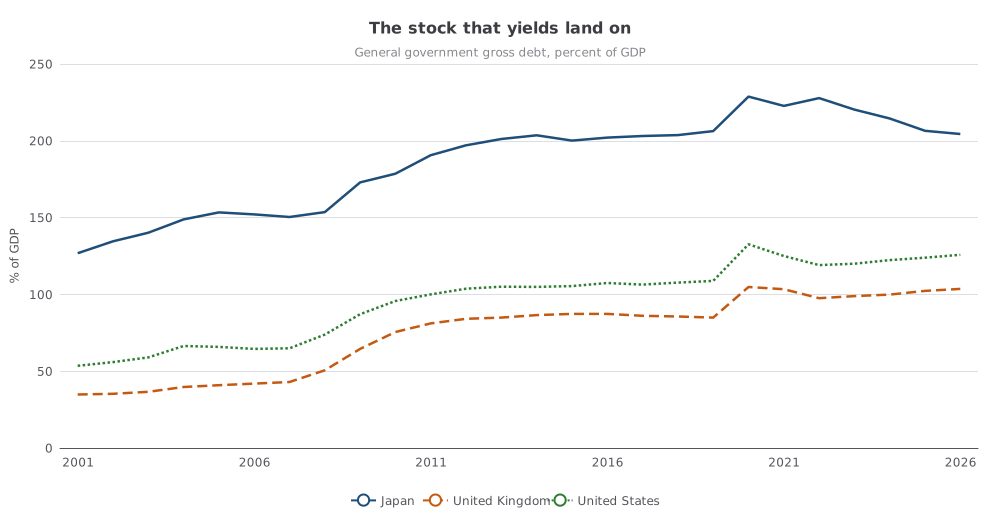
General-government gross debt, percent of GDP. Choose Japan, the United Kingdom or the United States on the gross-debt series page. 2025–26 are projections. Source: IMF WEO.
Inflation is not doing the work for them
The bond sell-off was sold as an inflation scare. In the same WEO vintage, average consumer-price inflation in 2026 is projected at 2.2 percent in Japan, 3.2 percent in the United Kingdom and 3.2 percent in the United States. Japan’s 2023 outturn was 3.3 percent; the Fund does not have Japan back in a 3-percent-yield inflation regime. A 0.15 percent average interest rate against 2.2 percent inflation is still a deeply negative real rate on the existing stock. That is the opposite of a fiscal crisis in the current accounts. It is also why markets can panic about the next bonds while this year’s budget still looks cheap.
What the 2 September print actually changed
The war-and-oil shock of early September is not in these IMF numbers. The snapshot was built from a mid-August 2026 vintage; 2025 and 2026 are projections, and they predate both the $95 oil print and the 3.015 percent JGB. They cannot tell us how far the average rate will travel if 3 percent JGBs and 5.3 percent gilts persist.
They can tell us what was already true before the tantrum. Japan’s problem is the world’s largest advanced-economy debt stock financed at a vanishing average rate. Britain’s problem is a debt ratio that has doubled since the last time gilts yielded 5.3 percent, so that even a lower average rate now consumes more of GDP. The United States already pays more interest, as a share of the economy, than either of them. Headline yields announce the price of the next auction. The IMF’s books still show who has started paying it.
Methods and sources
This is retrospective research completed on 10 September 2026 about events reported on 2 September 2026. It uses a pinned IMF World Economic Outlook snapshot (normalized run 20260824T140954Z, raw extract 10 August 2026), not an as-of reconstruction of what was knowable that morning.
Market yields (Japan 3.015 percent; UK “just below 5.3 percent”) are attributed news prints, not IMF series. Implied net interest is GGXONLB_NGDP minus GGXCNL_NGDP. The catalogue’s display name for GGXONLB_NGDP says “structural balance”; the IMF series code is primary net lending/borrowing, and the US identity (interest about half of the 2026 deficit) matches that reading. The measure is net interest, so Japan’s large public financial assets pull the ratio down relative to gross coupon payments. 2025–26 figures are WEO projections. Browser and mobile chart layout were not separately tested beyond SVG rendering.
Research Date
The displayed date matches the related news edition. Research was completed 2026-09-10.
Related news: Daily · 2026-09-02
More Research
The Border Surge Ended In February. The Asylum Crackdown Did Not.
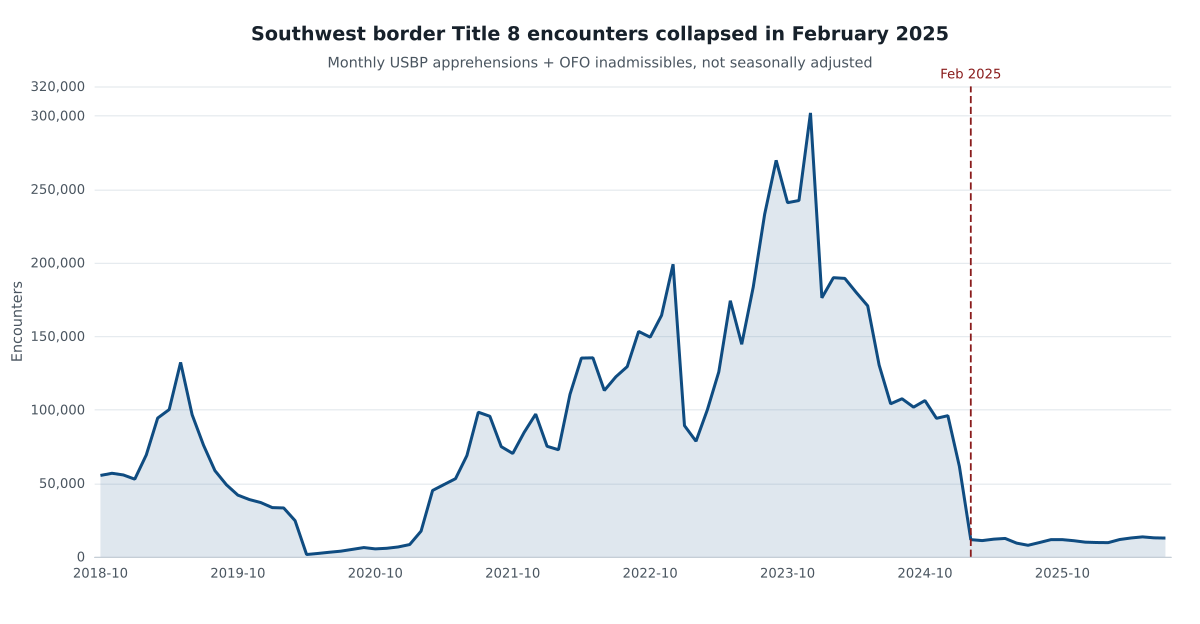
Title 8 southwest-border encounters collapsed in February 2025 and stayed near 11,000 a month through mid-2026, long before the reported June asylum-denial spike.
Japan’s 3% Yield Is A Cheap-Debt Problem, Not A 2025 Blowout
Japan’s 10-year yield at 3 percent is a break with cheap borrowing, not a 2025 IMF budget blowout: the COVID deficit had already narrowed, and residual interest remained tiny beside the Unit
The Black Sea Is Deadly Again. Annual Grain Prices Are Not Back At 2022.
IMF annual wheat averaged $173 a ton in 2025, about half the 2022 peak, even as Black Sea attacks again threaten grain exports.