LunarWeave
The Black Sea Is Deadly Again. Annual Grain Prices Are Not Back At 2022.
In July, more commercial crew were killed in the Black Sea than in the entire Russia–Ukraine war before that month, The Guardian reported, as strikes on ships and ports again interrupted grain loadings. The fear that followed was familiar: if Black Sea wheat and maize cannot move, world food prices spike.
That is the right fear to have. It is not, yet, what the International Monetary Fund’s annual commodity accounts show. In the Fund’s World Economic Outlook vintage ingested in August 2026, the 2022 war-year remains the spike. Wheat’s 2025 average was about half that peak. Cereals as a group had fallen back to around their 2020 level. A later monthly bounce can still be real. It would not, on this evidence, be a rerun of 2022.
Wheat did spike. Then it halved.
The IMF’s wheat price, in dollars per metric ton, averaged $360.17 in 2022 — the highest calendar year in this vintage from 2000 through 2025. That print was not only a wartime shock against the quiet late 2010s. It was 22.9% above 2008, the previous global food-crisis year in the same series ($292.97).
By 2025 the annual average had fallen to $173.09, 51.9% below 2022 and 40.9% below 2008. It was only 6.0% above 2019 ($163.26), the last pre-pandemic year. The same WEO vintage assumes $201.40 for 2026. That is a rebound from 2025, and it is still 44.1% below 2022. It is an assumption, not a realized annual average.
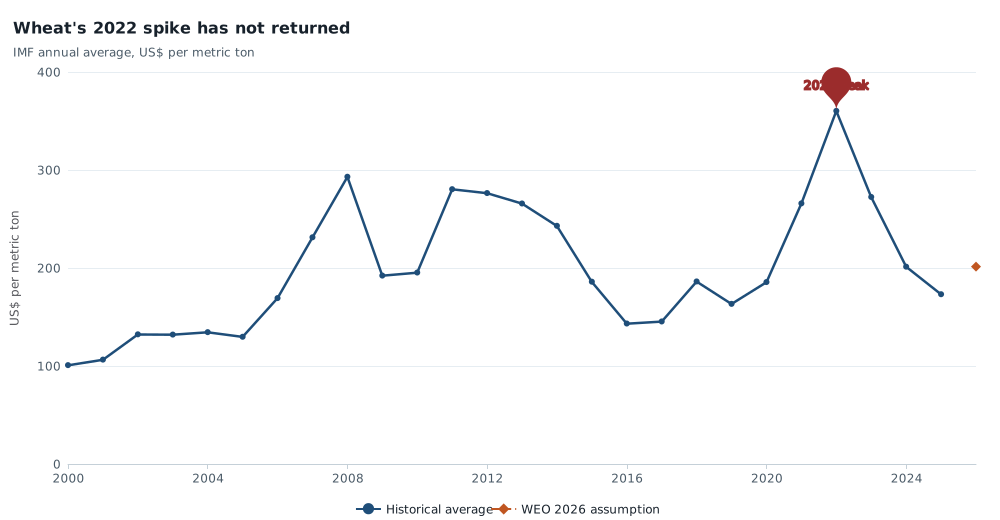
IMF annual average wheat price, US dollars per metric ton, 2000–2026. 2000–2025 are historical averages in the World Economic Outlook vintage ingested 10 August 2026. 2026 is the Fund’s assumption in that vintage. This is a global benchmark series, not a Black Sea export quotation, and it is not the FAO’s monthly food-price index. Source: IMF World Economic Outlook.
Maize moved the same way, less extremely: $318.36 a ton in 2022, $203.01 in 2025 — 36.2% lower. Rice did not. Its 2022 average ($419.06) was not the peak in this window; 2008 was ($700.20). Rice then rose again in 2023–24 ($528.57, then $565.18) before dropping to $384.13 in 2025. A Black Sea story that treats “grain” as one market will misread rice.
The grain complex deflated more than “food”
The IMF cereals price index — wheat, maize, rice and barley, 2016=100 — averaged 209.11 in 2022 and 119.98 in 2025, 42.6% below the war year and almost back to 2020 (119.12). The broader food price index, which also folds in vegetable oils, meat, seafood, sugar and fruit, fell much less: 147.40 in 2022, 127.08 in 2025, 13.8% down. Vegetable oils dropped 26.2% from 2022 to 2025. Food and beverages, a still-wider basket, were only 6.5% below 2022.
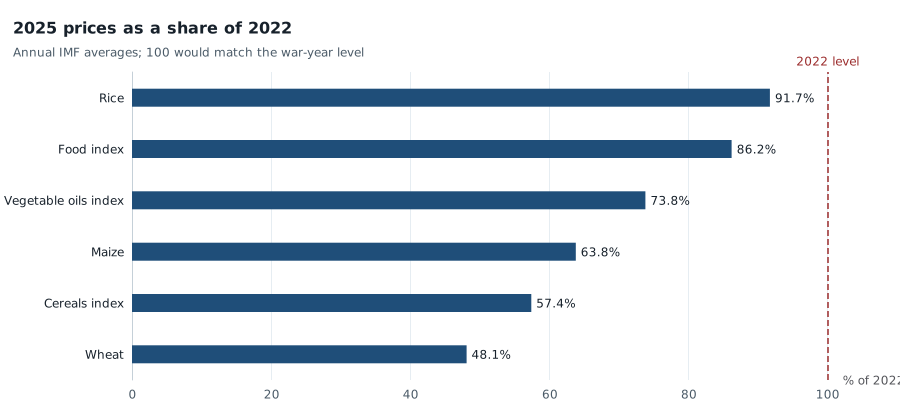
Each bar is that series’ 2025 annual average as a percent of its own 2022 annual average. Wheat, maize and rice are US dollars per metric ton; the others are IMF indexes (2016=100). Rice’s 2000–2025 peak in this vintage is 2008, not 2022. Source: IMF World Economic Outlook.
That split is the useful fact. Headlines about “food prices” can rise while the Black Sea staple is still cheap by 2022 standards, because the food index is not a wheat index. In this vintage the food index itself also fell every year from 2023 through 2025 (137.43, then 133.14, then 127.08). The 2026 assumption, 134.69, is still below both 2023 and 2022.
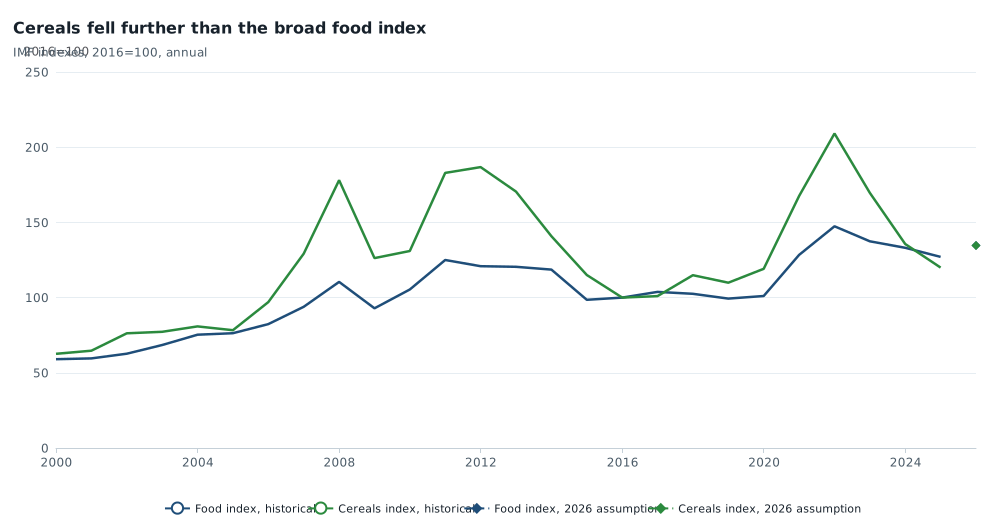
IMF food price index and cereals price index, 2016=100, annual. Solid lines are 2000–2025 historical averages; diamonds are 2026 WEO assumptions. Neither series is the FAO monthly Food Price Index. Source: IMF World Economic Outlook.
| Series | 2008 | 2019 | 2022 | 2025 | 2026 assumption* | 2025 vs 2022 |
|---|---|---|---|---|---|---|
| Wheat (US$/mt) | 292.97 | 163.26 | 360.17 | 173.09 | 201.40 | −51.9% |
| Maize (US$/mt) | 223.36 | 170.17 | 318.36 | 203.01 | 222.34 | −36.2% |
| Rice (US$/mt) | 700.20 | 396.51 | 419.06 | 384.13 | 434.09 | −8.3% |
| Cereals index (2016=100) | 178.04 | 109.88 | 209.11 | 119.98 | 134.61 | −42.6% |
| Food index (2016=100) | 110.41 | 99.37 | 147.40 | 127.08 | 134.69 | −13.8% |
*2026 figures are IMF WEO assumptions in this vintage, not realized annual averages.
A monthly high is not a 2022 rerun
Reporting in early September 2026, citing Bloomberg and the UN Food and Agriculture Organization, said global food prices had just risen to their highest monthly level since late 2022. That claim is about the FAO Food Price Index, a monthly basket. It is not tested here. It can be true at the same time as the IMF’s annual food index for 2025 sitting 13.8% below 2022, because a late-summer monthly print can be the highest in three years without pulling a calendar-year average back to a war peak.
The IMF series are also not Black Sea export prices. They are global benchmarks. A blocked Ukrainian or Russian loading can lift regional export quotes, freight and insurance without immediately rewriting these annual averages. Shipping deaths in July are not a 2025 price.
What the annual accounts can say is narrower, and more useful for the present scare: the last fully recorded grain year in this vintage does not look like 2022. Wheat is back near 2019. Cereals are back near 2020. The food index is still elevated against the 2010s, because it never fully deflated, but it is not at the war-year high. If Black Sea attacks now recreate that high, they will be reversing a three-year decline — not extending a plateau that never ended.
Methods and sources
This is retrospective research dated 10 September 2026. Commodity prices are from the pinned IMF World Economic Outlook snapshot created 24 August 2026 (raw run 10 August 2026). That vintage predates the 4 September 2026 news; 2026 figures in the file are still Fund assumptions, not realized annual averages.
All figures are annual averages from that vintage. Years 2000–2025 are treated as historical in the WEO file; 2026–2031 are Fund assumptions. Values are nominal US dollars or indexes with 2016=100. They are not inflation-adjusted, not monthly, and not FAO. SVG rendering is not a browser or mobile layout check.
Research Date
The displayed date matches the related news edition. Research was completed 2026-09-10.
Related news: Daily · 2026-09-04
More Research
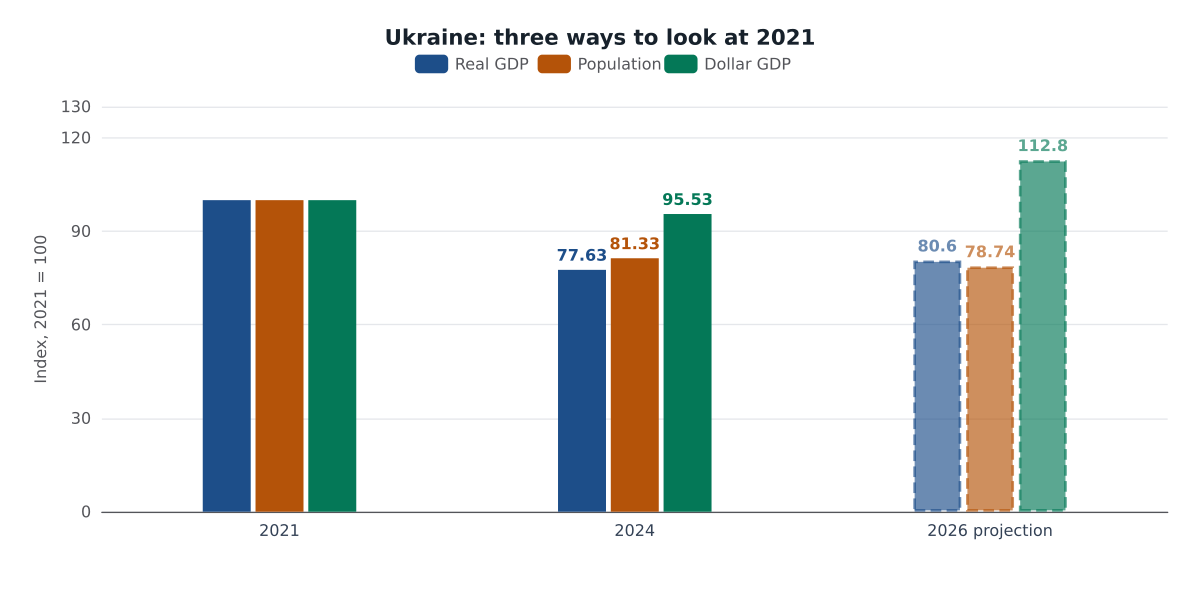
Ukraine’s Real Economy Is Still A Fifth Smaller Than Before The Invasion
IMF accounts show Ukraine’s constant-price output still about a fifth below 2021, even as dollar GDP looks recovered.
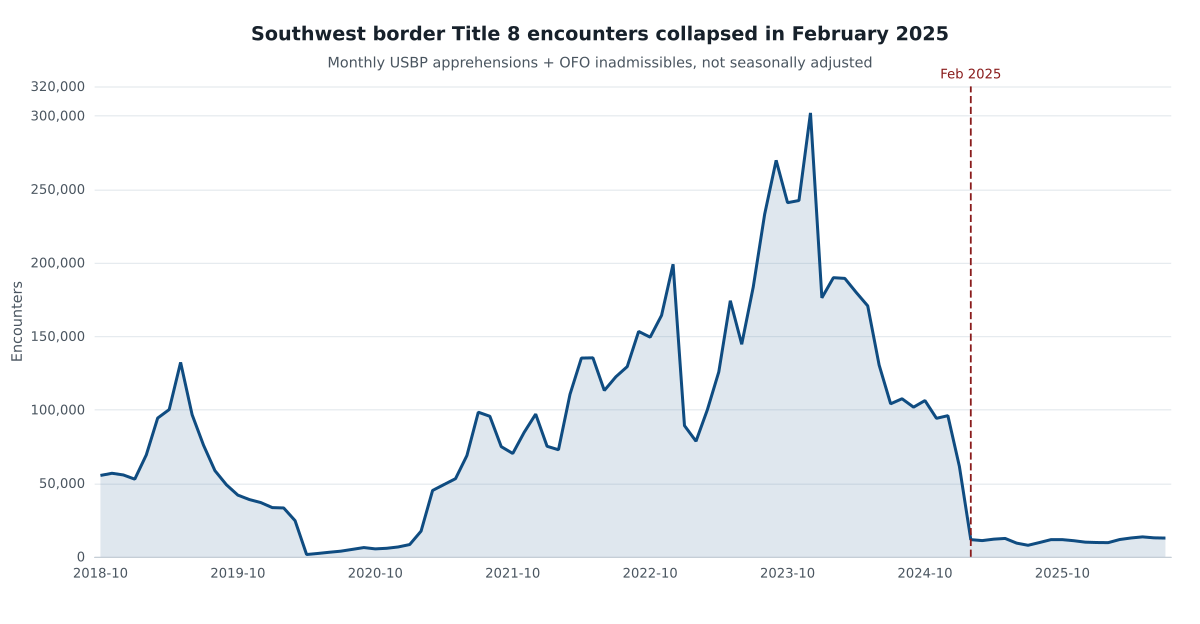
The Border Surge Ended In February. The Asylum Crackdown Did Not.
Title 8 southwest-border encounters collapsed in February 2025 and stayed near 11,000 a month through mid-2026, long before the reported June asylum-denial spike.
South Korea’s Chip Cycle Rebuilt The Surplus. It Did Not Rebuild Growth.
IMF accounts show South Korea’s current-account surplus back near a decade high in 2025 while real GDP grew only 1 percent — a chip-cycle surplus, not a growth boom.