LunarWeave
Ukraine’s Real Economy Is Still A Fifth Smaller Than Before The Invasion
When American envoys sat down in Moscow with a proposal to end the war, they were not bargaining over the Ukraine of 2021. In the International Monetary Fund’s World Economic Outlook, constant-price output in 2024 was still 22.4 percent below its last pre-invasion year. The Fund’s 2026 projection trims that gap only to 19.4 percent — and even 2031 remains 3.0 percent short of 2021.
That is the economy a settlement would freeze: not a rebound interrupted, but a smaller productive base that the IMF’s own medium-term path does not restore.
A collapse that two recoveries have not closed
Ukraine’s real GDP growth rate in the WEO fell 28.8 percent in 2022. The rebound that followed was real, and modest: 5.5 percent in 2023 and 3.2 percent in 2024. Indexed to 2021, that leaves 2024 at 77.6. The snapshot then projects 1.8 percent in 2025 and 2.0 percent in 2026, taking the index to 80.6.
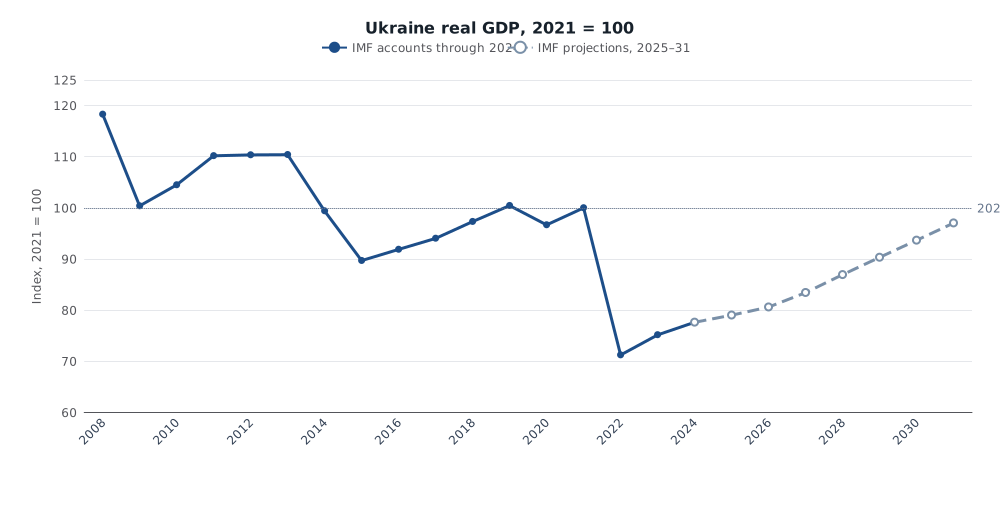
IMF World Economic Outlook constant-price GDP for Ukraine, indexed to 2021 = 100. Solid line through 2024; dashed line is the snapshot’s 2025–31 projections. Wartime figures are estimates. Source: IMF WEO.
The 2022 drop was not Ukraine’s first lost decade in these tables. Real output in 2021 was already 9.4 percent below 2013, after the 2014–15 shock. By 2024 the gap versus 2013 was 29.7 percent. A peace deal struck on 2026 terms would therefore close a war that, in the Fund’s accounts, has compounded an earlier break rather than interrupting a peak.
The 2025–31 figures are forecasts in this snapshot, not outturns. They also do not say why growth stays low. They simply do not show a return to 2021.
Dollars recovered. Output did not.
Current-dollar GDP tells a friendlier story, and it is the wrong one for a production question. Ukraine’s GDP in current US dollars was $199.8 billion in 2021, $162.0 billion in 2022, and $190.8 billion in 2024 — almost back. The 2026 projection is $225.3 billion, 12.8 percent above 2021, in the same year real output is still 19.4 percent below.
The third series in the same database explains part of the optical illusion. The WEO population figure used as a national-accounts denominator fell from 41.0 million in 2021 to 34.5 million in 2022 and is projected at 32.3 million in 2026. That is not a body count. It is the Fund’s working population: refugees, coverage of territory the accounts no longer treat as measurable, and wartime estimation, mixed together. It is still the denominator that makes per-person figures look healthier than the country.
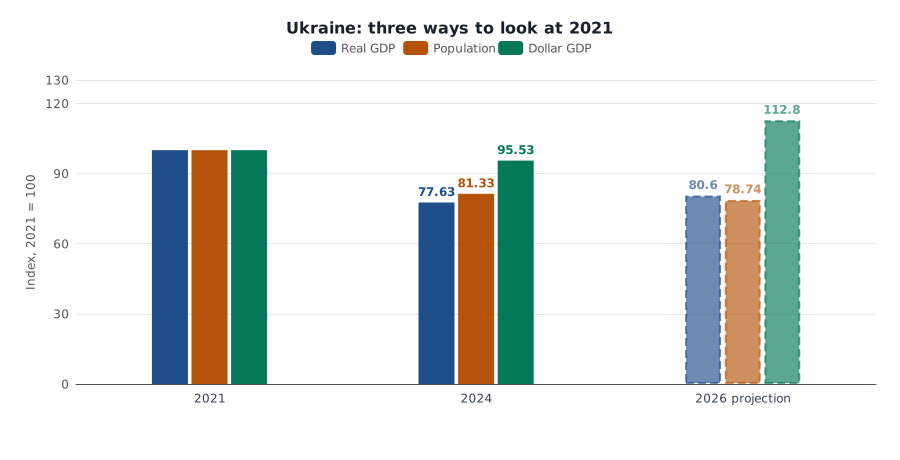
Same IMF tables, three measures, 2021 = 100. Real GDP is constant-price output. Population is the WEO denominator, not a census of deaths. Dollar GDP moves with prices and the exchange rate. 2026 bars are projections (dashed outlines). Choose Ukraine in the dollar-GDP chart selector. Source: IMF WEO.
Constant-price GDP per person in the IMF series fell 15.4 percent in 2022, was 4.6 percent below 2021 in 2024, and is projected 2.4 percent above 2021 in 2026. Dollar GDP per person rises more sharply still, from about $4,900 in 2021 to a projected $7,000 in 2026. Those per-person gains are what you get when the remaining population in the tables shrinks faster than output comes back. They do not mean the country’s productive capacity has been rebuilt.
| Year | Status in this snapshot | Real GDP (2021=100) | Population (2021=100) | Dollar GDP (2021=100) | Real growth (%) | Dollar GDP ($ bn) | Population (mn) |
|---|---|---|---|---|---|---|---|
| 2021 | WEO estimate | 100.0 | 100.0 | 100.0 | 3.4 | 199.8 | 41.0 |
| 2022 | WEO estimate | 71.2 | 84.2 | 81.1 | −28.8 | 162.0 | 34.5 |
| 2024 | WEO estimate | 77.6 | 81.3 | 95.5 | 3.2 | 190.8 | 33.3 |
| 2026 | Projection | 80.6 | 78.7 | 112.8 | 2.0 | 225.3 | 32.3 |
Unemployment in the same tables jumped from 9.9 percent in 2021 to 24.5 percent in 2022, then 13.1 percent in 2024 and 10.2 percent in the 2026 projection. That series is among the people the Fund still counts. It cannot describe workers who left.
The export machine is still missing about a third of 2021
The war’s economic ledger is not only domestic output. Chaining the IMF’s export-volume growth rates from a 2021 base of 100 leaves 2022 at 56.5, 2023 at 51.7, and 2024 at 60.4 — still 39.6 percent below 2021. The 2026 projection reaches only 68.4.
That is the backdrop to Kyiv’s push, reported as U.S. envoys travelled, for diplomatic food corridors with Egypt, Turkey, the United Arab Emirates and Saudi Arabia after strikes on Odesa. Kyiv Post relayed a cut to Ukraine’s 2026–27 grain-export forecast; Rzeczpospolita described climbing wheat prices. Those reported tonnages and spot prices are not in these WEO tables. What the Fund does show is that Ukraine’s export volume had not, as of 2024, recouped anything like the 2021 level — and the 2026 projection still leaves it about a third short.
A state running a wartime budget on a smaller economy
General-government net lending/borrowing was already about −4.0 percent of GDP in 2021. It was −15.6 percent in 2022, −19.3 percent in 2023, and −17.2 percent in 2024. The snapshot’s 2025 and 2026 projections are −23.3 and −18.4 percent. Gross debt in the same accounts rose from 48.9 percent of GDP in 2021 to 89.7 percent in 2024 and 122.6 percent in 2026.
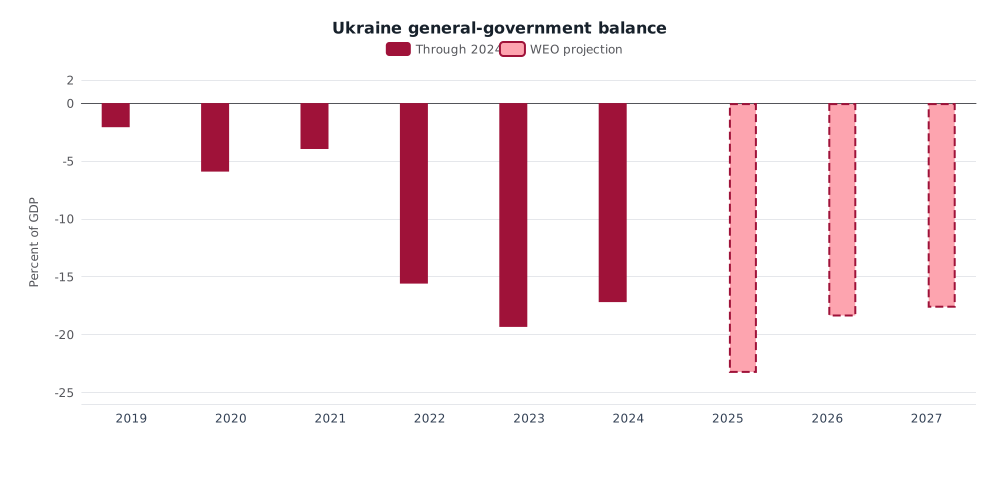
IMF general-government net lending/borrowing, percent of GDP. Negative values are deficits. Solid bars through 2024; dashed bars are 2025–27 projections. This is the consolidated government balance, not household debt. Source: IMF WEO.
The current account moved the other way in the invasion year — a 4.5 percent of GDP surplus in 2022, as imports collapsed — then to −8.0 percent in 2024 and −18.9 percent in the 2026 projection. A settlement would inherit both a government still borrowing at wartime rates and an external gap the Fund does not close in 2026.
None of this measures the cost of reconstruction, occupied industrial plant, or a demobilized army. It is the IMF’s annual macro picture: output, people in the accounts, the budget, and trade volumes. On those measures, the country American diplomats were discussing in Moscow is not waiting to snap back to 2021. In the Fund’s books it is smaller, more indebted, and still missing a large share of its export capacity — and the projection through 2031 does not give 2021 back.
Sources and methods
This is retrospective research completed on 10 September 2026, using the IMF World Economic Outlook database snapshot retrieved via SDMX on 10 August 2026 (normalized 24 August 2026). It is not an as-of reconstruction of what was knowable on 5 September 2026. Figures for 2025–31 are treated as projections: the 2025 and 2026 real-growth rates are one-decimal round numbers typical of WEO forecasts, and WEO current and later years are not realized outturns. 2024 and earlier remain Fund estimates for a wartime economy, not audited national accounts. Population is the WEO denominator, not a census. Constant-price GDP is in national currency; dollar GDP is a separate current-price series and is not a real-output measure. Export-volume indexes are chained from the WEO annual percent-change series and inherit any revision in those rates. Charts were rendered to SVG; they have not had separate browser or mobile layout testing.
Underlying series: IMF WEO NGDP_R, NGDP_RPCH, NGDPD, NGDPDPC, NGDPRPC, LP, LUR, TX_RPCH, GGXCNL_NGDP, GGXWDG_NGDP, BCA_NGDPD for Ukraine. Official source: IMF World Economic Outlook.
Research Date
The displayed date matches the related news edition. Research was completed 2026-09-10.
Related news: Daily · 2026-09-05
More Research
South Korea’s Chip Cycle Rebuilt The Surplus. It Did Not Rebuild Growth.
IMF accounts show South Korea’s current-account surplus back near a decade high in 2025 while real GDP grew only 1 percent — a chip-cycle surplus, not a growth boom.
The Black Sea Is Deadly Again. Annual Grain Prices Are Not Back At 2022.
IMF annual wheat averaged $173 a ton in 2025, about half the 2022 peak, even as Black Sea attacks again threaten grain exports.
Pay Raises Are Back To 2019. The Hiring Boom Is Not.
July 2026 private hourly raises were the slowest in five years, but they match 2018–19. Hiring does not: private payrolls added about 53,000 jobs a month versus 177,000 in 2015–19.