LunarWeave
Pay Raises Are Back To 2019. The Hiring Boom Is Not.
On Labor Day 2026, American workers were described as stuck: unhappy in their jobs, and unconvinced that leaving would pay. O Globo reported that pay increases had slowed to the weakest pace in more than five years, and that people who did switch jobs were no longer collecting the jumps that defined 2021 and 2022.
The payroll survey run by the U.S. Bureau of Labor Statistics supports the five-year low. It does not support a new collapse in pay. What has actually broken is the job market around those raises. Hourly earnings have returned to their late-2010s speed. Hiring has not.
A five-year low that looks like 2018
In July 2026, private-sector employees earned an average of $37.62 an hour, seasonally adjusted. That was 3.2 percent more than in July 2025, when the same average was $36.47. It is the slowest 12-month gain in that series since May 2021.
The lost boom is real. From July 2021 through July 2026, the peak 12-month rate was 5.9 percent in March 2022. By July 2022 it was still 5.5 percent. Every one of the 12 months to July 2026 came in below 4 percent.
The missing piece in the “weakest in five years” headline is the comparison that is not 2022. Across 2018 and 2019, 12-month growth in this series averaged 3.2 percent — the same pace as July 2026. December 2019, at 3.0 percent, was a little slower. July 2026 is a return to the pre-pandemic raise, not a break below it.
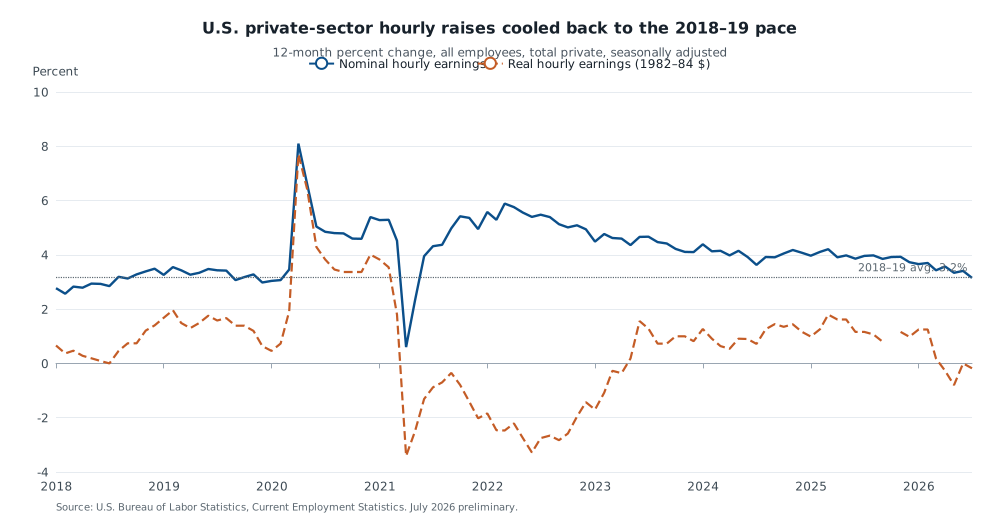
Twelve-month percent change in seasonally adjusted average hourly earnings of all private-sector employees, United States, January 2018–July 2026. The solid line is current dollars; the dashed line is the same series in 1982–84 dollars. The dotted reference is the 2018–19 average of the nominal series (3.2%). April 2020 and the following year are distorted by pandemic job-mix and base effects. July 2026 is preliminary. Source: U.S. Bureau of Labor Statistics, Current Employment Statistics (CES0500000003, CES0500000013).
The April 2020 spike on that chart is not a raise Americans received. When low-wage jobs disappeared, the remaining average jumped. The 2022 peak is the one that matches the bargaining boom.
Production and nonsupervisory employees — the BLS grouping closer to a typical worker — tell the same cooling story. Their average hourly pay was $32.40 in July 2026, 3.2 percent above a year earlier.
| July | 12-month change in private hourly pay |
|---|---|
| 2019 | 3.4% |
| 2021 | 4.3% |
| 2022 | 5.5% |
| 2023 | 4.7% |
| 2024 | 3.6% |
| 2025 | 4.0% |
| 2026 | 3.2% |
Seasonally adjusted average hourly earnings of all employees, total private. July 2026 is preliminary. Source: BLS CES, CES0500000003.
Prices caught the raises. Hours did not hide the slowdown.
A 3.2 percent raise is a living-standards gain only if prices rise more slowly. In the BLS constant-dollar version of the same series — average hourly earnings in 1982–84 dollars, deflated with the CPI-W — July 2026 was 0.2 percent below July 2025. Over the year, the average worker’s hour bought slightly less, not more.
That stall comes after a recovery, not instead of one. Real hourly pay bottomed in mid-2022, when inflation outran even 5 percent nominal raises, then climbed through 2025. July 2026, at $11.30 in 1982–84 dollars, is 2.6 percent above February 2020 and 3.1 percent above July 2019. Six-plus years produced a small real gain. The last year produced none.
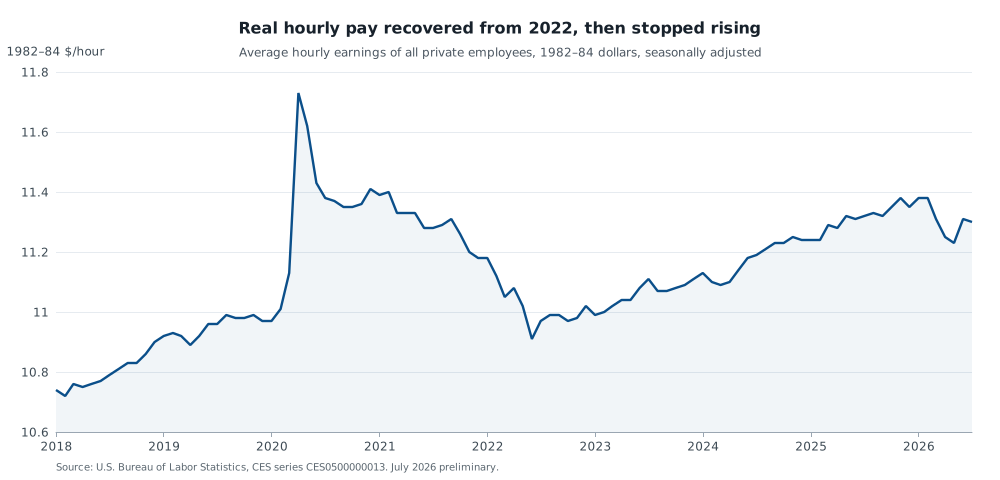
Seasonally adjusted average hourly earnings of all private-sector employees in 1982–84 dollars, United States, January 2018–July 2026. This is a constant-price yardstick, not take-home pay. The April 2020 jump is a composition effect from low-wage job losses, not a raise. July 2026 is preliminary. Source: BLS CES CES0500000013.
Nominal pay is still far above early 2020: $37.62 an hour is 32 percent above February 2020’s $28.54. Almost all of that increase covered prices.
If firms were quietly cutting take-home pay, the workweek would be an easy place to do it. They have not. Average weekly hours for all private employees were 34.3 in July 2026, the same as in February 2020, and a tenth of an hour above July 2025. Manufacturing hours, often the first to flex, were 40.4 versus 40.5 before the pandemic. Weekly earnings rose 3.5 percent over the year because the hour ticked up, not because the week shrank.
Production workers did keep more of the boom in real terms. Their constant-dollar hourly pay in July 2026 was 4.5 percent above February 2020, a larger gain than the all-employee average. The slowdown is broad. It has not erased the 2021–22 lift for the lower-paid half of the payroll.
The abnormal number is hiring
The reason a 2019-speed raise now feels like being stuck is that 2019’s job market is gone.
Private payrolls were 135.6 million in July 2026, up 631,000 from July 2025 — 0.5 percent, or about 53,000 jobs a month. From 2015 through 2019 the same survey averaged 177,000 private jobs a month. In 2022–23 it averaged 251,000. The latest three months were slower still: payrolls rose 121,000 from April to July.
That is not a measure of quits, openings, or “ghost” listings, and it cannot prove why any one worker stayed put. It does show that the easy outside offer has become rarer. Switching jobs is how many people beat inflation. A market that adds fewer than one-third as many private jobs as it did in the late 2010s gives that tactic much less room.
Where the remaining raises are
The cooling is not even. Compared at June 2026, the latest month shared by the industry series here, leisure and hospitality hourly pay was up 4.0 percent over the year and manufacturing 3.9 percent. Professional and business services rose 3.3 percent. Health care, at 2.2 percent, was the slowest of this group — even though that is a sector that has kept adding jobs. The 2021 leisure-and-hospitality spike, which peaked at 13.8 percent in November 2021, is over.
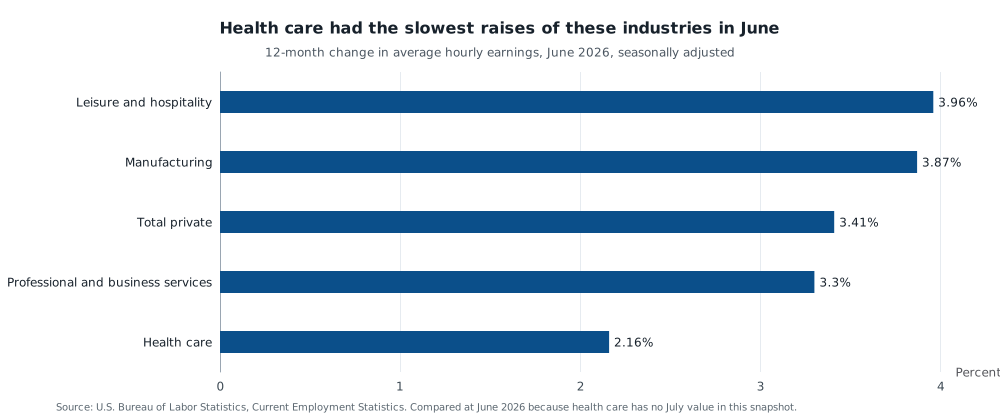
Twelve-month percent change in seasonally adjusted average hourly earnings of all employees, June 2026 versus June 2025, United States. Health care is compared at June because that series has no July 2026 value in this snapshot. Source: BLS CES.
These are averages across whoever is on payrolls, not the raise any one person received by staying or leaving. A shift toward higher- or lower-paid jobs can move the average without anyone’s wage changing. That composition problem was acute in 2020. It is a smaller, not zero, caveat in 2026.
What the five-year low actually means
The Labor Day complaint was that raises had faded and that leaving no longer paid. On the first point, the payroll survey agrees: 3.2 percent is the slowest 12-month private hourly gain since spring 2021. On the second, the same survey is more specific than a vibe. Real hourly pay has stopped rising over the past year, hours have not been cut to disguise it, and private hiring has slowed to about 30 percent of its 2015–19 monthly pace.
Workers are not taking a 2022-style cut. They are being asked to live with 2019 raises in a market that no longer hires like 2019. That is a narrower problem than a wage collapse, and a harder one to wait out.
Sources and methods
This article is retrospective. The news it answers ran on 7 September 2026; the calculations use a frozen Current Employment Statistics snapshot (BLS release bls-ce-snapshot-2026-08-24) whose latest month is July 2026, marked preliminary. Research was completed on 10 September 2026. Later CES revisions are not in this snapshot.
Figures are national, seasonally adjusted monthly averages from the CES payroll survey, not the household survey and not a fixed panel of workers. Constant-dollar earnings are the BLS 1982–84-dollar series, not an independent deflator. Twelve-month rates compare the same calendar month a year apart. Industry comparisons use June 2026 because health-care hourly earnings in this snapshot end that month. JOLTS quits, job-posting “ghost” rates, and union membership are outside these extracts; reported claims about them are not treated as measured findings here.
Series documentation is in the BLS CES Handbook of Methods and the CES series file. The monthly Employment Situation publishes the same earnings and hours concepts.
Research Date
The displayed date matches the related news edition. Research was completed 2026-09-10.
Related news: Daily · 2026-09-07
More Research
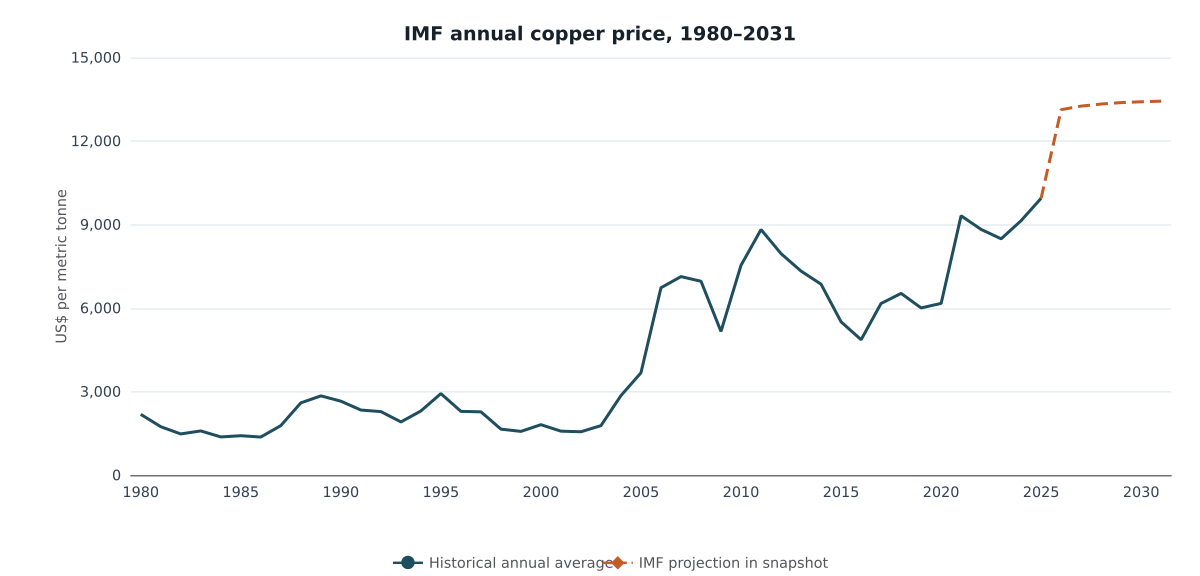
Copper’s Record Was Already On The Books. Chile Still Runs A Deficit.
IMF annual copper was already at a record in 2025. Chile’s current account and budget were still in deficit.
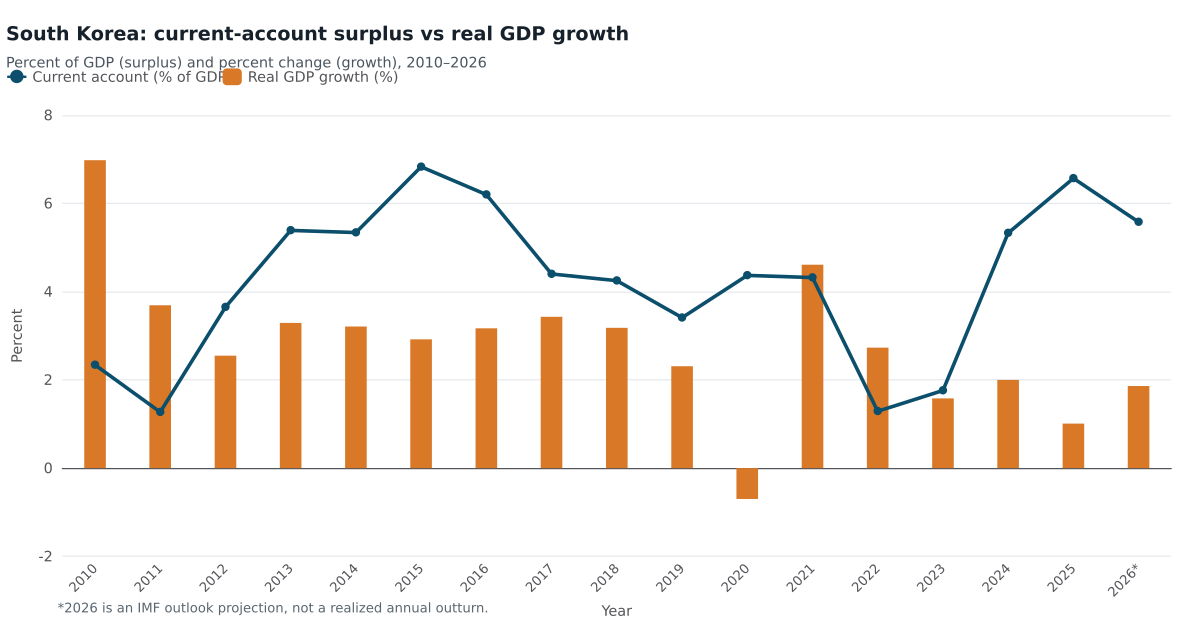
South Korea’s Chip Cycle Rebuilt The Surplus. It Did Not Rebuild Growth.
IMF accounts show South Korea’s current-account surplus back near a decade high in 2025 while real GDP grew only 1 percent — a chip-cycle surplus, not a growth boom.
Europe Cut Gas-Fired Power. It Did Not Get Off It.
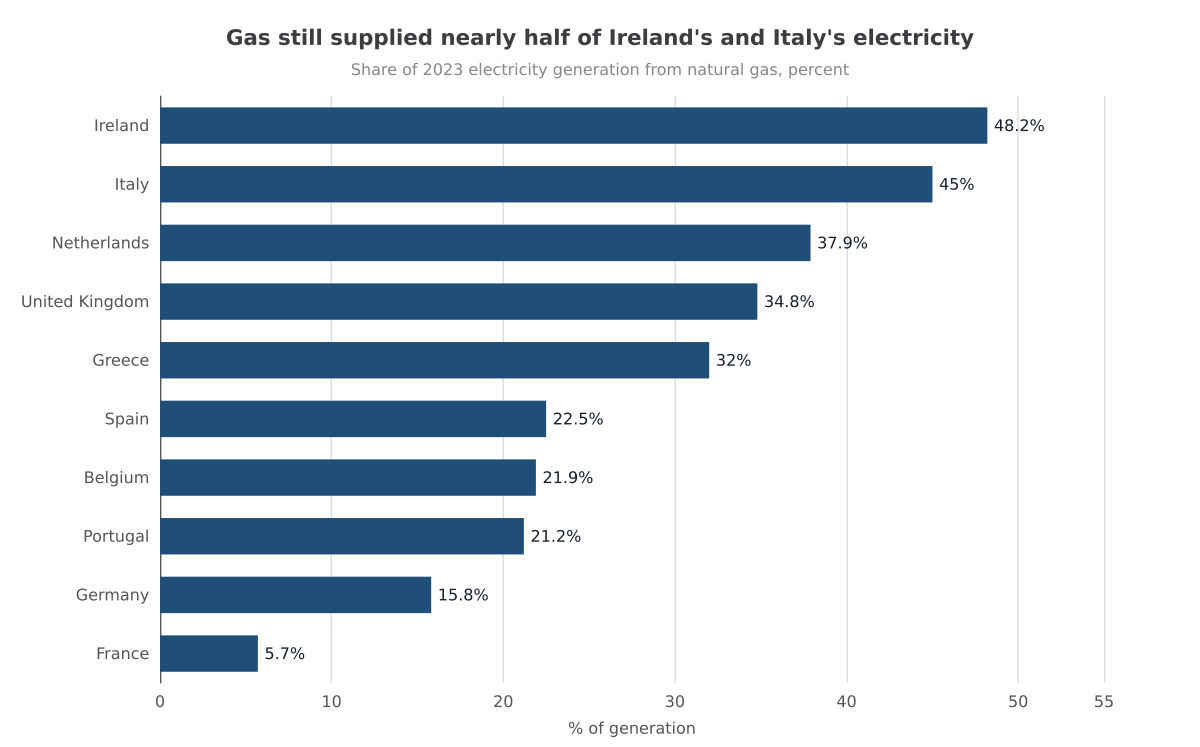
After 2022, gas still generated 48% of Ireland's electricity and 45% of Italy's in 2023 — the last IRENA year before the September 2026 TTF spike.