LunarWeave
Europe Cut Gas-Fired Power. It Did Not Get Off It.
When Dutch TTF gas futures — Europe’s benchmark contract — printed €80.99 a megawatt-hour on 9 September 2026, the move looked like a rerun of the 2022 energy crisis. AFP, reporting in Le Soir, said the contract had not been that high since January 2023. The agency blamed US-Iran attacks on shipping in the Middle East and European storage that was already thin for the season. Households will feel that first in boilers. They will also feel it in the power stack, because several large European electricity systems still burn a lot of gas.
The last complete year in IRENA’s country generation statistics is 2023. That is not the 2026 mix, and later wind and solar additions are outside this snapshot. What 2023 can answer is whether the post-invasion gas crisis actually took gas out of electricity. It reduced the volumes. It did not remove the fuel.
Almost half the power in Ireland and Italy
In 2023, natural gas generated 48.2% of Ireland’s electricity and 45.0% of Italy’s. The Netherlands was at 37.9%, Britain at 34.8% and Greece at 32.0%. Spain, Belgium and Portugal clustered just above 21%. Germany, which closed its last reactors that year, still took 15.8% of its power from gas. France, with a recovering nuclear fleet, took 5.7%.
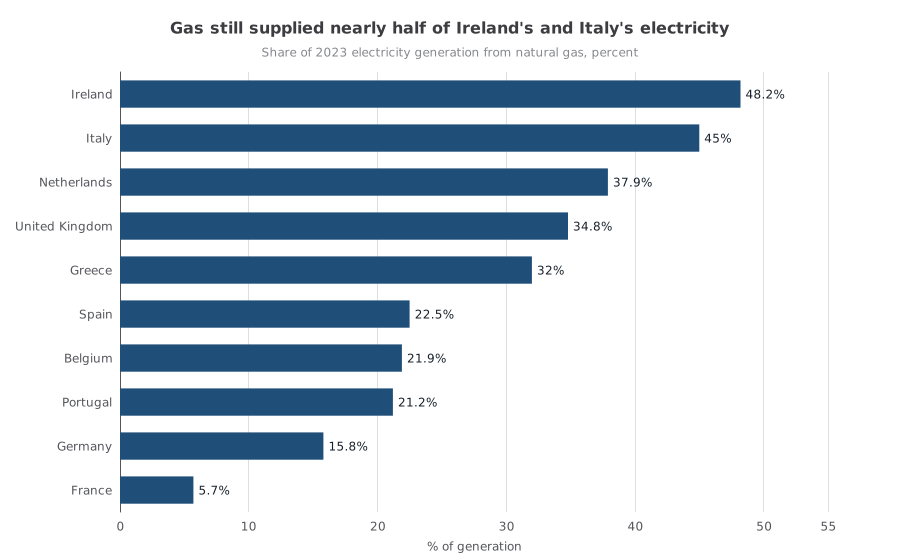
Natural-gas share of electricity generation in 2023, percent. Each bar is IRENA electricity from natural gas divided by IRENA total renewable plus total non-renewable generation (all grids). 2023 is the latest year in the snapshot. Electricity is not household heating. Source: International Renewable Energy Agency, IRENASTAT.
Those shares are not a curiosity of small islands. Italy generated 119.0 TWh from gas in 2023; Britain 102.2 TWh; Germany 80.9 TWh. Spain and the Netherlands added 64.3 TWh and 46.0 TWh. Together those five systems produced 412 TWh of gas-fired electricity — enough that a TTF spike still lands on a large slice of western Europe’s actual generation, not only on a residual peaker plant.
| Country | Gas share, 2021 | Gas share, 2023 | Gas generation, 2023 |
|---|---|---|---|
| Ireland | 47.3% | 48.2% | 15.4 TWh |
| Italy | 49.8% | 45.0% | 119.0 TWh |
| Netherlands | 46.4% | 37.9% | 46.0 TWh |
| United Kingdom | 40.0% | 34.8% | 102.2 TWh |
| Greece | 41.1% | 32.0% | 16.0 TWh |
| Spain | 26.1% | 22.5% | 64.3 TWh |
| Belgium | 22.4% | 21.9% | 18.3 TWh |
| Portugal | 30.5% | 21.2% | 10.4 TWh |
| Germany | 16.4% | 15.8% | 80.9 TWh |
| France | 6.0% | 5.7% | 29.8 TWh |
Shares are gas generation divided by IRENA renewable plus non-renewable generation. Source: IRENASTAT.
Volumes fell. Some shares did not.
Italy’s gas-fired output dropped from 144.0 TWh in 2021 to 119.0 TWh in 2023. Britain’s fell from 123.4 TWh to 102.2 TWh, Germany’s from 97.0 TWh to 80.9 TWh, the Netherlands’ from 56.7 TWh to 46.0 TWh. Ireland did not follow: 15.2 TWh in 2021 and 15.4 TWh in 2023, with the gas share up 0.9 percentage points.
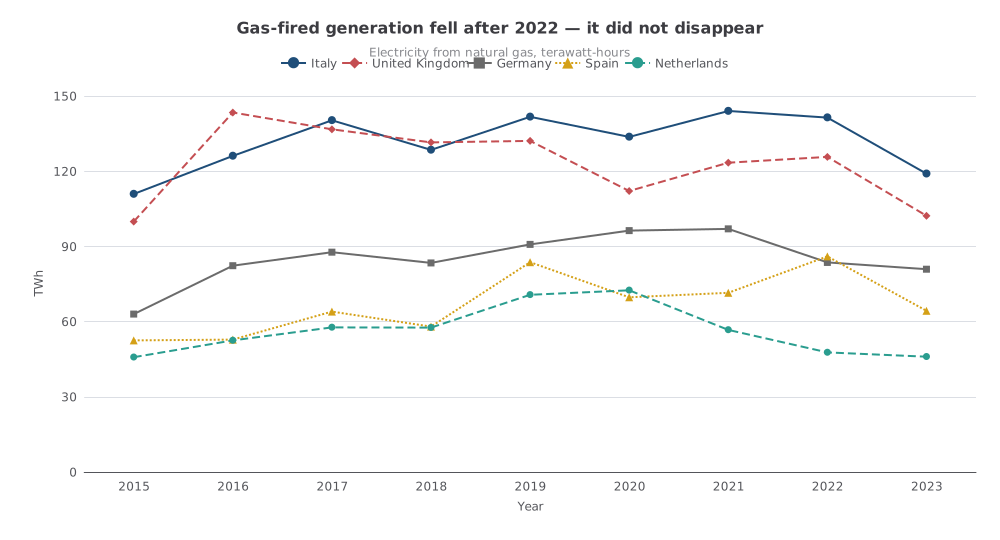
Electricity generated from natural gas, terawatt-hours, 2015–2023 (IRENA gigawatt-hours ÷ 1,000). Source: IRENASTAT.
Where substitution is visible, it is uneven. Dutch renewable generation rose from 22.8 TWh in 2019 to 56.8 TWh in 2023, and the gas share of Dutch electricity fell 8.5 percentage points between 2021 and 2023. Portugal’s share dropped from 30.5% to 21.2%; Greece’s from 41.1% to 32.0%. Italy’s share fell 4.9 points and remained near half. Germany’s share barely moved (−0.6 points) even as coal-and-peat generation slumped from 189.5 TWh in 2022 to 134.9 TWh in 2023 and nuclear output collapsed from 34.7 TWh to 7.2 TWh after the final plant closures. Germany generated less electricity overall — 511.9 TWh in 2023 against 592.8 TWh in 2021 — but gas stayed in the mix.
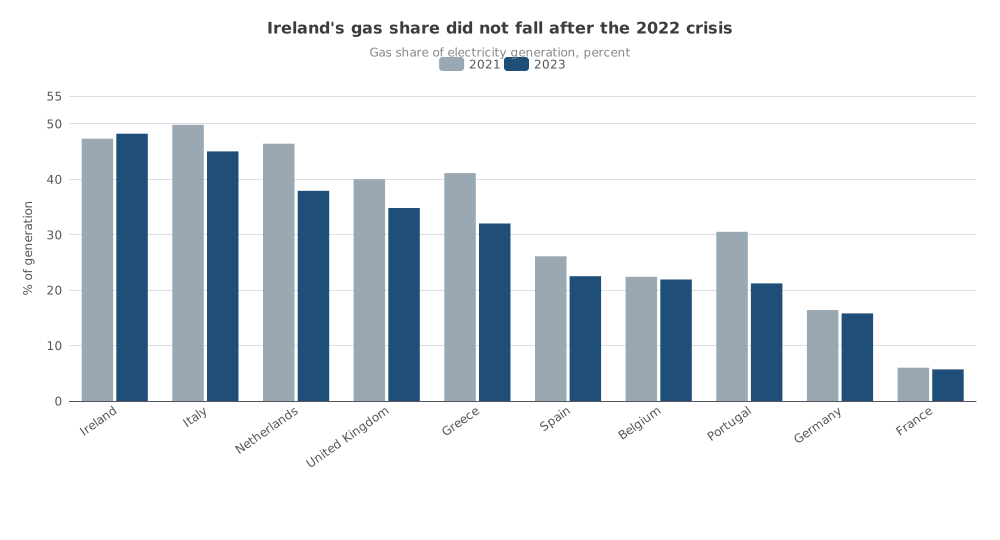
Gas share of electricity generation in 2021 versus 2023, percent. Source: IRENASTAT.
France is the exception that tests the rule. Nuclear output fell from 379.4 TWh in 2021 to 294.7 TWh in 2022, and gas-fired generation jumped from 33.3 TWh to 45.7 TWh (9.6% of the 2022 mix). In 2023 nuclear recovered to 338.2 TWh and gas dropped back to 29.8 TWh, or 5.7%. When the nuclear fleet stumbled, gas filled in. That is what a TTF spike costs in a system that still has the plants.
What a 2026 price spike can and cannot tell us
A wholesale gas price is not an electricity bill, and electricity is not most of Europe’s gas demand. IRENA’s generation figures say nothing about household boilers, industrial heat, or how full storage was in September 2026. They also stop in 2023: two winters of extra solar and wind could have shaved the 2026 shares without appearing here.
They do establish something narrower, and useful. After the 2022 shock, Ireland still generated almost half its electricity from gas. Italy still generated 45.0%, and more than a hundred terawatt-hours of it. Britain, the Netherlands and Greece were in the thirties. Germany’s gas share was little changed even as coal and nuclear receded. Gas can also set the wholesale power price on the margin even where its share of kilowatt-hours is smaller than Italy’s; that merit-order effect is a market mechanism, not a quantity measured in these tables.
The September 2026 TTF print was a price shock on a fuel Europe still burns for power. The 2022 crisis cut the burn. It did not retire the exposure.
Sources and methods
This is a retrospective article. The news day is 9 September 2026; the calculations use an IRENASTAT snapshot compiled on 24 August 2026, whose country generation series end in 2023. Later revisions and 2024–2026 generation are not in the file.
Electricity from natural gas, total renewable generation and total non-renewable generation are IRENA “All” grid series in gigawatt-hours. The gas share is gas divided by renewable plus non-renewable generation; pumped storage is not added on top of that total, to avoid double-counting. IRENA’s regional “Europe” aggregate includes the Russian Federation and is not used here as a measure of TTF-exposed markets. The Netherlands series is IRENA’s “Netherlands (Kingdom of the)” geography; the United Kingdom series is IRENA’s full UN-style name. Figures in the text are rounded to one decimal place from those extracts. The €80.99/MWh TTF print is AFP’s reported futures price, not an IRENA observation.
IRENA public tables: pxweb.irena.org. News: AFP via Le Soir, 9 September 2026.
Research Date
The displayed date matches the related news edition. Research was completed 2026-09-10.
Related news: Daily · 2026-09-09
More Research
Copper’s Record Was Already On The Books. Chile Still Runs A Deficit.
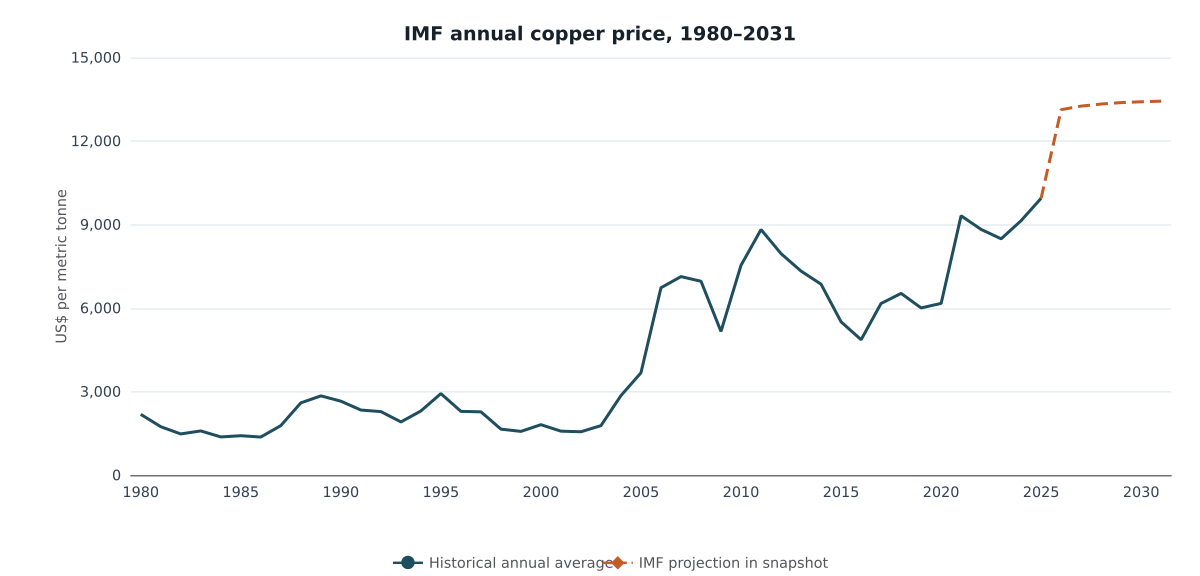
IMF annual copper was already at a record in 2025. Chile’s current account and budget were still in deficit.
Pay Raises Are Back To 2019. The Hiring Boom Is Not.
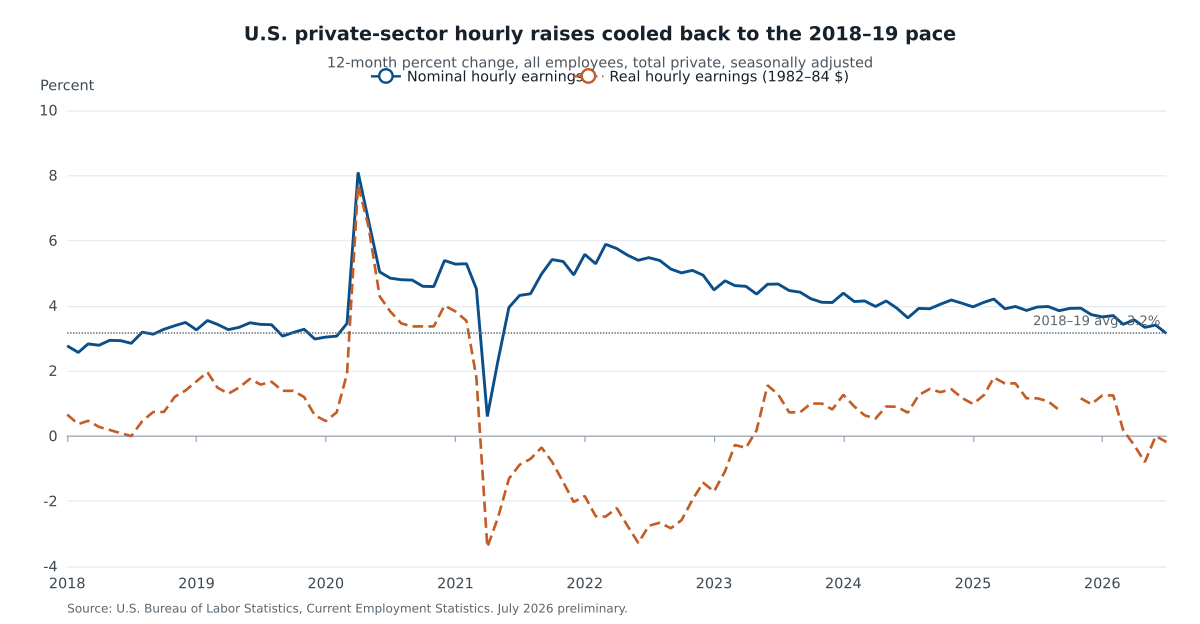
July 2026 private hourly raises were the slowest in five years, but they match 2018–19. Hiring does not: private payrolls added about 53,000 jobs a month versus 177,000 in 2015–19.
South Korea’s Chip Cycle Rebuilt The Surplus. It Did Not Rebuild Growth.
IMF accounts show South Korea’s current-account surplus back near a decade high in 2025 while real GDP grew only 1 percent — a chip-cycle surplus, not a growth boom.