LunarWeave
Copper’s Record Was Already On The Books. Chile Still Runs A Deficit.
Three-month copper on the London Metal Exchange closed at $14,510 a tonne, after an intraday print of $14,533, according to the South China Morning Post. The paper described an all-time high, a break above January’s previous record, and a scramble for stockpiles ahead of possible US tariffs. For factories that buy the metal, that is a cost shock. For the countries that mine it, it sounds like a windfall.
It is the second claim that does not survive the official annual record.
The IMF World Economic Outlook already shows 2025 as the highest calendar-year copper price in a series that begins in 1980: $9,947 a tonne. That annual average sits 12.7 percent above the 2011 supercycle year ($8,823) and 6.8 percent above 2021 ($9,317). The Fund’s 2026 figure in the same snapshot is $13,127 — a 32.0 percent jump from 2025, then a plateau near $13,400 through 2031. Monday’s futures print is about 10.5 percent above that 2026 annual path. It is a new high against a boom that was already in the books, not a market that was cheap until that session.
Those IMF figures are annual averages, in current US dollars per metric tonne, not daily or three-month LME closes. A year that spends months at $14,500 can still average less. The 2026–31 values are projections in a snapshot compiled in August 2026; they are not realized 2026 averages, and they cannot confirm a September session.
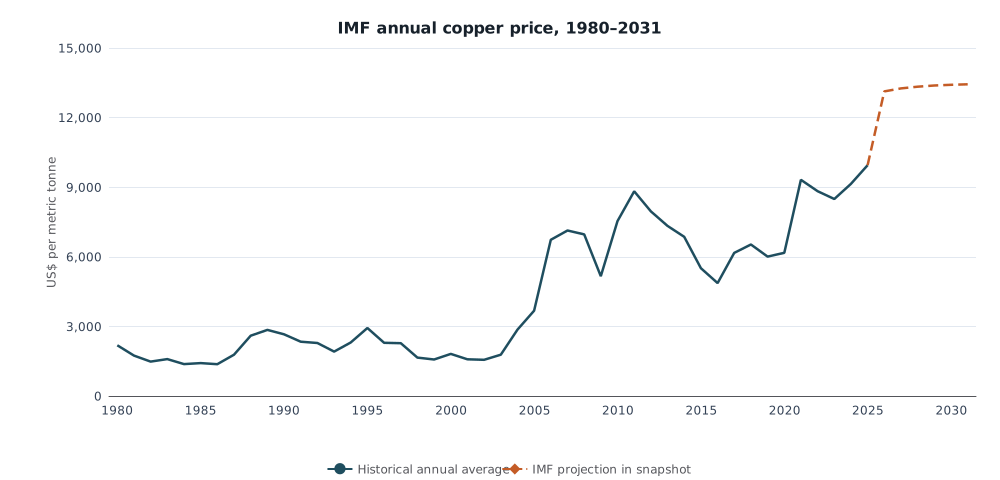
Annual average copper price in US dollars per metric tonne (IMF WEO series PCOPP). Solid line: 1980–2025. Dashed line: 2026–2031 projections in the August 2026 snapshot. These are calendar-year averages, not LME futures prints. Source: IMF World Economic Outlook.
Copper has pulled away from the rest of the metals basket
The same database carries a metals price index set to 100 in 2016. By 2025 that basket stood at 188.8 — still 9.8 percent below its 2011 peak of 209.4. Copper, rebased the same way, had more than doubled from 2016. The 2021–25 copper rise is therefore not just “metals are expensive.” It is copper outrunning the basket.
Aluminum, the other big industrial metal in the file, makes the same point from the other side. Its 2025 annual average ($2,631 a tonne) was still 2.8 percent below 2022. The IMF then projects a 27.0 percent jump in 2026 — and a fade, back to $2,924 by 2031. Copper’s projected path does not fade. If the Fund is right, this is a copper plateau, not a one-year spike shared by all base metals.
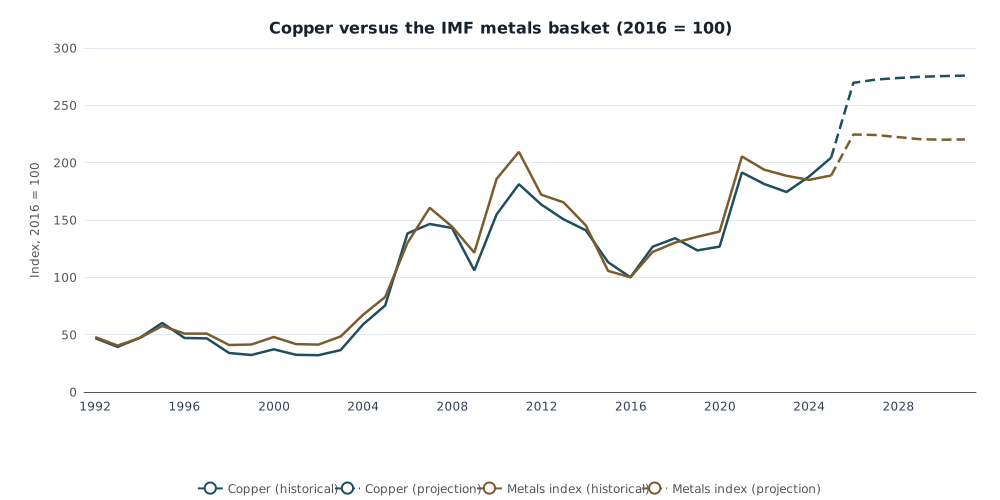
Copper annual averages rebased to 2016 = 100, against the IMF metals price index (already 2016 = 100). Solid lines through 2025; dashed lines are projections. Source: IMF World Economic Outlook.
None of this verifies the tariff story, or the stockpile scramble. It does change what “record copper” means. In annual data, the record was 2025. The new LME print is a higher-frequency peak on top of that.
The largest-sounding boom is not a 2011-style expansion in Chile
If a $10,000-then-$13,000 copper price were a generic gift to miners, Chile’s macro data would look like 2011. They do not.
In 2011, when copper’s annual average was $8,823, Chile’s real GDP grew 6.2 percent. In 2025, with copper 12.7 percent higher than that in nominal dollars, growth was 2.3 percent. The IMF still has Chile expanding only 2.4 percent in 2026. The government budget remained in deficit: net lending of −2.8 percent of GDP in 2025, after −2.8 percent in 2024. Choose Chile in the chart selector; the page does not pre-fill the country.
The current account — exports, imports, and income flows with the rest of the world, as a share of GDP — is the sharper test of whether a commodity boom is landing in the external accounts. Chile was still in deficit in 2025, at −2.3 percent of GDP. Peru ran a surplus of 3.1 percent. Zambia was still in deficit at −3.5 percent, with the Fund projecting a small surplus only in 2026.
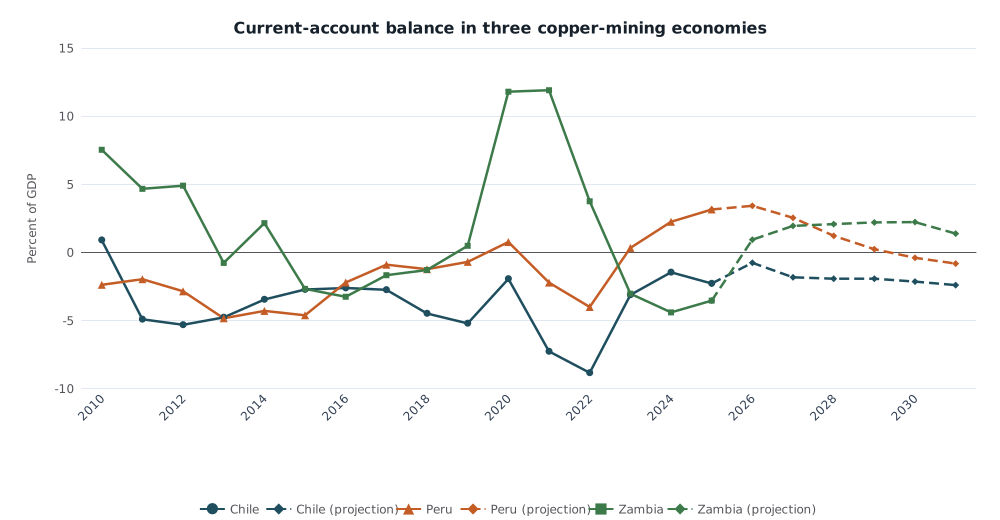
Current-account balance, percent of GDP. Solid lines: 2010–2025. Dashed lines: 2026–2031 projections. A surplus is not copper revenue, and a deficit is not proof that copper prices failed. Source: IMF World Economic Outlook. On the linked current-account page, select Chile, Peru or Zambia; there is no geography in the URL.
| Year | Copper, $/t | Metals index (2016=100) | Chile CA, % GDP | Peru CA, % GDP | Chile real GDP, % |
|---|---|---|---|---|---|
| 2011 | 8,823 | 209.4 | −4.9 | −2.0 | 6.2 |
| 2021 | 9,317 | 205.4 | −7.3 | −2.2 | 11.3 |
| 2022 | 8,829 | 193.9 | −8.8 | −4.0 | 2.2 |
| 2025 | 9,947 | 188.8 | −2.3 | 3.1 | 2.3 |
| 2026* | 13,127 | 224.5 | −0.8 | 3.4 | 2.4 |
*2026 figures are projections in the August 2026 IMF snapshot, not realized annual outcomes. Copper and the metals index are world commodity series; the country columns are national accounts.
Chile’s current account was more negative in 2021–22, when copper was already historically high and real GDP briefly grew 11.3 percent. Domestic demand can swamp a terms-of-trade gain. The 2025 deficit is smaller than 2011’s −4.9 percent. That is not a copper bust. It is also not the 6 percent growth that accompanied the last time the metal made headlines as a supercycle.
The file does not allocate Chile’s or Peru’s exports by product, so it cannot say what share of either current account is copper. It cannot score a US tariff. It cannot turn a Monday LME close into a 2026 annual average. What it can say is narrower, and more useful: the annual price is already in record territory, the IMF is not treating that as a spike that fades, and the same snapshot still has Chile in current-account and budget deficit at growth of about 2 percent — while Peru is already in surplus.
For buyers, $14,500 is the number that hits the invoice. For anyone reading that print as a South American boom, the annual record arrived last year, and Chile has not spent it like 2011.
Sources and methods
This is retrospective research dated 10 September 2026, using a pinned IMF World Economic Outlook snapshot compiled on 10–24 August 2026. The news day is 8 September 2026. Later data were not available on that day; the LME prints are attributed to contemporary reporting, not to the IMF file.
Copper is WEO series PCOPP (US$ per metric tonne); the metals basket is PMETAW (index, 2016 = 100); aluminum is PALUM. In this dataset those commodity series are stored under geography G001, a commodity-price bucket, not a country. National series are current-account balance as a percent of GDP (BCA_NGDPD), real GDP percent change (NGDP_RPCH), and general-government net lending as a percent of GDP (GGXCNL_NGDP). Values for 2026–31 are treated as projections. Percent changes and dollar roundings are from analysis/calculate.py against the saved extracts. Browser layout of the charts was not separately tested.
Research Date
The displayed date matches the related news edition. Research was completed 2026-09-10.
Related news: Daily · 2026-09-08
More Research
Europe Cut Gas-Fired Power. It Did Not Get Off It.
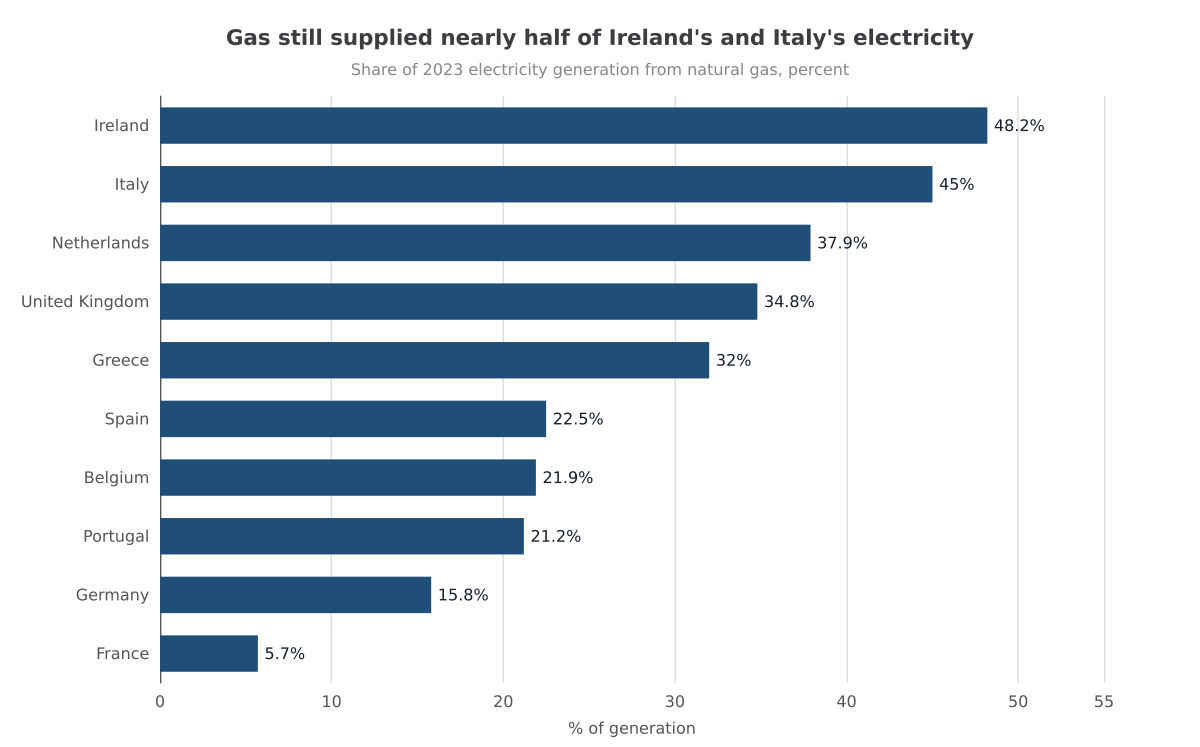
After 2022, gas still generated 48% of Ireland's electricity and 45% of Italy's in 2023 — the last IRENA year before the September 2026 TTF spike.
Pay Raises Are Back To 2019. The Hiring Boom Is Not.
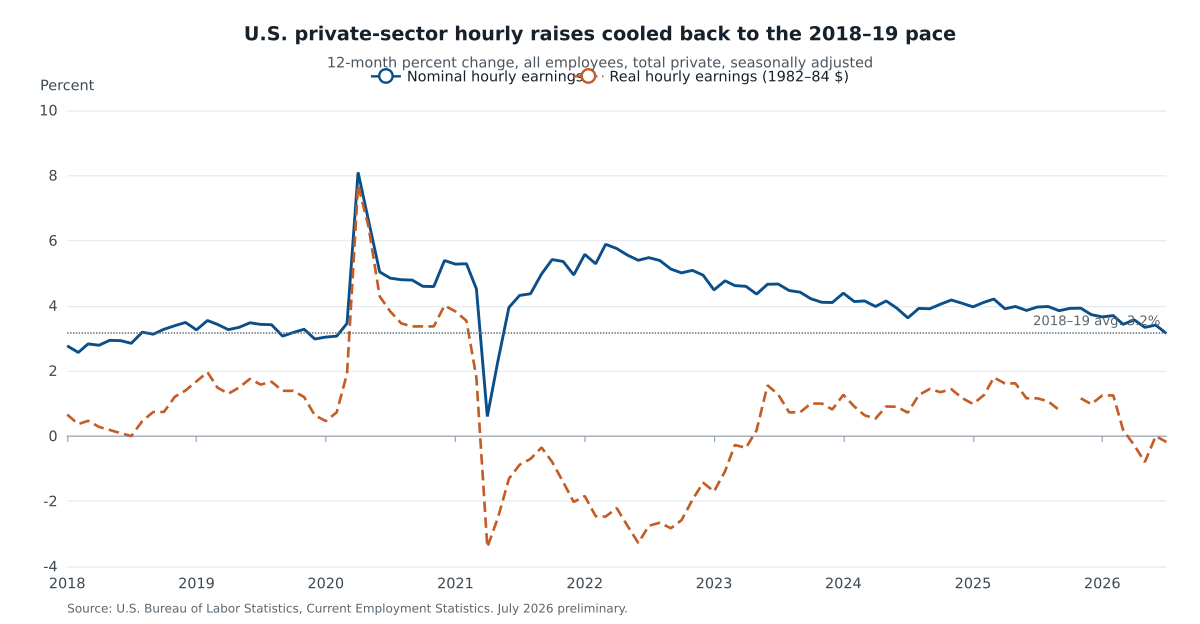
July 2026 private hourly raises were the slowest in five years, but they match 2018–19. Hiring does not: private payrolls added about 53,000 jobs a month versus 177,000 in 2015–19.
South Korea’s Chip Cycle Rebuilt The Surplus. It Did Not Rebuild Growth.
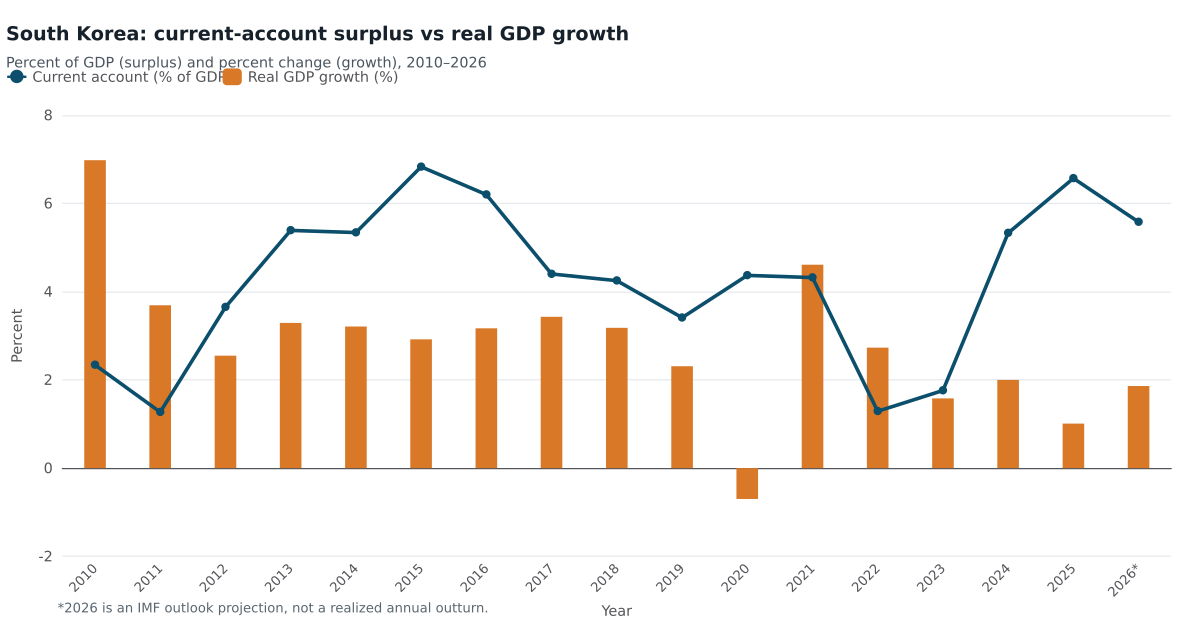
IMF accounts show South Korea’s current-account surplus back near a decade high in 2025 while real GDP grew only 1 percent — a chip-cycle surplus, not a growth boom.