LunarWeave
South Korea’s Chip Cycle Rebuilt The Surplus. It Did Not Rebuild Growth.
When South Korea’s trade ministry tallied January–August 2026, the headline was a boom. Merchandise exports reached $693.3 billion, up 52.8 percent from a year earlier, The Dong-a Ilbo reported, citing the Ministry of Trade, Industry and Energy. Semiconductors accounted for $281.2 billion of that — 40 percent of shipments, up from 23 percent a year earlier — and for 74 percent of the entire increase. Cars, the other historic pillar, posted their largest drop in six years.
If chips now dominate the customs ledger, the question worth asking is whether the rest of the economy is booming with them. In the International Monetary Fund’s World Economic Outlook, it is not. The Fund’s books already show a current-account surplus back near a decade high. They do not show a growth surge, and they do not show anything like a 50 percent jump in real export volumes.
A fat surplus on a 1 percent economy
South Korea’s current-account surplus — the broad external balance covering goods, services and income, not a customs product mix — collapsed with the last chip downturn, to 1.3 percent of GDP in 2022 and 1.8 percent in 2023. It then snapped back to 5.3 percent in 2024 ($100 billion) and 6.6 percent in 2025 ($123 billion). That is a swing of 5.3 percentage points of GDP, or $100 billion, in three years. Among 1980–2025 observations in this WEO vintage, only two years were larger: 1998, the crisis year (10.1 percent of GDP), and 2015 (6.8 percent). Readers need to choose South Korea in the chart selector; the live page is a multi-country series.
Real output did not come with it. Constant-price GDP grew 2.0 percent in 2024 and only 1.0 percent in 2025. In the Fund’s annual series from 1980 through 2025, only four years were weaker: 1980, 1998, 2009 and 2020. This is not a jobs collapse sitting under that print. The unemployment rate was 2.8 percent in both 2024 and 2025. It is a slow-growth, full-employment surplus.
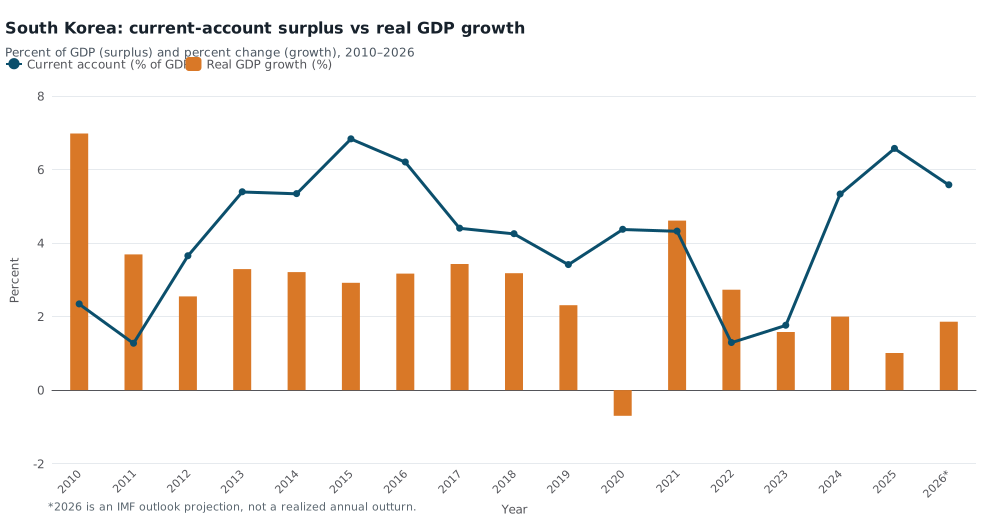
South Korea’s current-account balance as a percent of GDP (line) and real GDP growth (bars), 2010–2026. Units: percent. Source: IMF World Economic Outlook (pinned snapshot ingested 24 August 2026). 2025 is a WEO estimate; 2026 is an outlook projection, not a realized annual outturn. The current account is not customs merchandise exports or the semiconductor share of shipments.
The 2026 outlook in the same vintage still does not look like an export blowout. The Fund projects 1.9 percent growth, a slightly smaller surplus of 5.6 percent of GDP, and a 4.1 percent rise in the volume of exports of goods and services. That volume series rose 6.8 percent in 2024 and 4.2 percent in 2025 — mid-single digits, not 50 percent. Customs values can soar when chip prices do; the WEO’s volume and GDP figures are telling a quieter real-side story. The two measures are not substitutes, and this snapshot cannot test MOTIE’s 40 percent semiconductor share.
The surplus is mostly weaker investment
National accounts make the external surplus an identity, not a mystery: it is what the country saves minus what it invests, aside from statistical discrepancy. In this vintage the identity holds exactly in 2024–26.
Gross national savings were already high, and they barely moved — 34.4 percent of GDP in 2022, 35.7 percent in 2025. Total investment fell from 33.3 percent of GDP to 29.1 percent. The extra surplus is mostly that receding investment share, not a savings boom. The WEO does not say whether the drop is housing, plant, or inventories, and it does not isolate semiconductor capital spending. It does say the gap opened when domestic capital formation receded while saving stayed elevated.
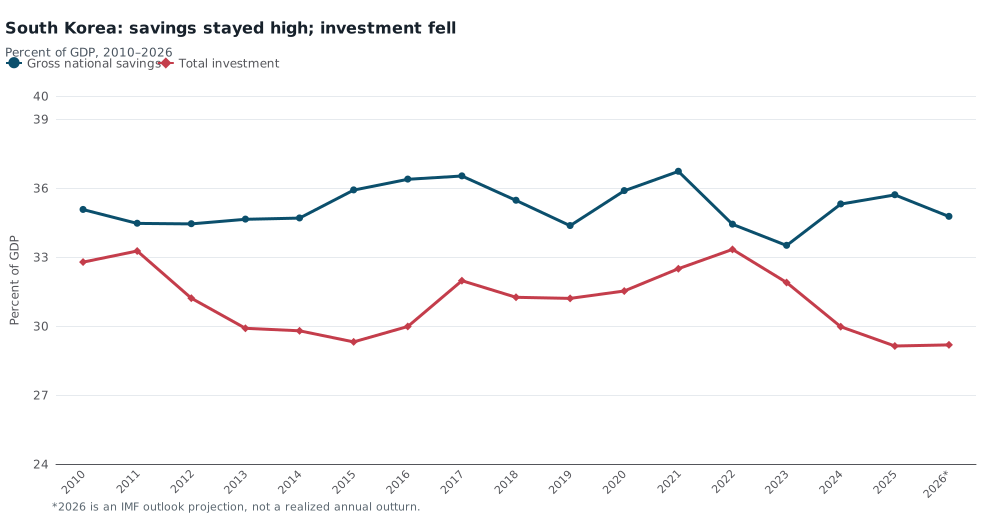
Gross national savings and total investment as a percent of GDP, South Korea, 2010–2026. Units: percent of GDP. Source: IMF World Economic Outlook (pinned snapshot ingested 24 August 2026). The current-account balance equals savings minus investment, aside from statistical discrepancy. 2026 is an IMF projection.
That pattern fits the customs contrast Dong-a reported — chips up, cars down — without proving it. A concentrated export boom can pad the external accounts through prices and profits while the rest of industry, and the domestic capital stock, do not expand. It is also what a soft domestic demand story looks like. The data here cannot separate those readings.
Taiwan shows what a chip boom that hits GDP looks like
Taiwan is the other large chip-cycle economy in the same WEO. Its 2025 current-account surplus is much larger, at 17.4 percent of GDP. Unlike Korea, that surplus arrived with an 8.7 percent real GDP increase and a 31.8 percent rise in export volumes. Korea’s 2025 pairing is 6.6 percent of GDP on the current account and 1.0 percent growth, with export volumes up 4.2 percent.
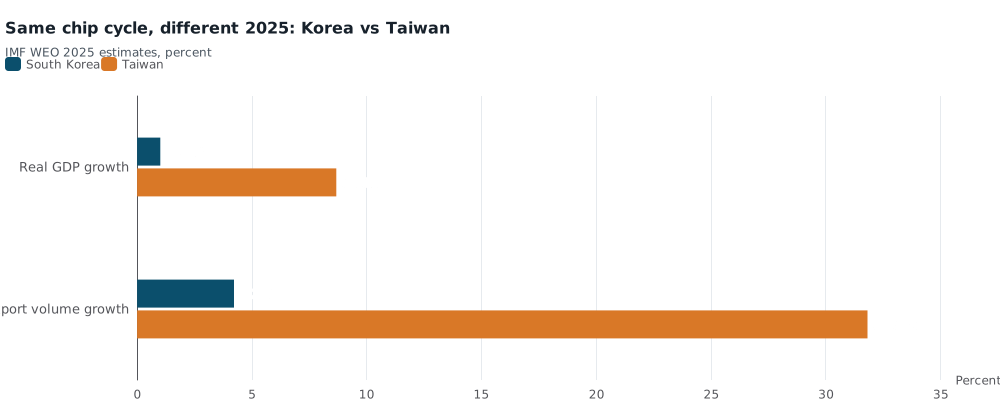
IMF World Economic Outlook estimates for 2025: real GDP growth and volume of exports of goods and services, South Korea versus Taiwan. Units: percent. Source: IMF WEO, pinned snapshot ingested 24 August 2026. 2025 figures are WEO estimates. Export volume is not semiconductor shipments and is not comparable to customs export values.
The comparison is not a claim that Taiwan “does chips better,” and export volume is still not a semiconductor series. It is a check on the idea that an AI-era chip upswing must show up as a growth boom in the annual accounts. In this vintage, it does in Taiwan. In Korea, the same years rebuilt the surplus and left real growth at a 1 percent crawl.
Korea’s 6.6 percent surplus is still large against other manufacturing peers in 2025: 4.8 percent in Japan, 4.4 percent in Germany, 3.7 percent in China. The United States ran a 3.6 percent deficit. Those are current-account ratios, not export-concentration scores.
| Year | Current account, % of GDP | Current account, $ bn | Real GDP growth, % | Export volume, % | Savings, % of GDP | Investment, % of GDP |
|---|---|---|---|---|---|---|
| 2022 | 1.3 | 23 | 2.7 | 3.9 | 34.4 | 33.3 |
| 2023 | 1.8 | 33 | 1.6 | 3.4 | 33.5 | 31.9 |
| 2024 | 5.3 | 100 | 2.0 | 6.8 | 35.3 | 30.0 |
| 2025* | 6.6 | 123 | 1.0 | 4.2 | 35.7 | 29.1 |
| 2026† | 5.6 | 108 | 1.9 | 4.1 | 34.8 | 29.2 |
*WEO estimate. †WEO outlook projection. Figures rounded from the pinned IMF WEO extract. Export volume is goods and services, not customs values.
What the 2026 customs boom would have to overturn
MOTIE’s January–August 2026 value surge can be real and still sit beside a 4 percent WEO export-volume path. Chip prices, product mix, and the gap between merchandise customs and national-accounts exports of goods and services all move the two series apart. What the Fund has not done, in a snapshot taken in August 2026, is rewrite Korean 2026 as a high-growth year. Dollar GDP is $1.87 trillion for 2025 and $1.93 trillion for 2026 in this vintage — not the arithmetic of an economy whose real exports are jumping by half.
That is the risk the customs numbers are pointing at, restated in accounts the catalogue can actually hold. Korea is already running a large external surplus on a slow domestic engine. If semiconductors now supply two-fifths of merchandise exports, a downswing does not need to “arrive”; the 2022–23 current-account collapse showed how fast the surplus can vanish. The missing piece in the WEO is not the surplus. It is the boom.
Sources and methods
This is retrospective research completed on 10 September 2026 about news from 6 September 2026. It uses a pinned IMF World Economic Outlook snapshot ingested on 24 August 2026 (raw run 10 August 2026), which can include later releases than were public that day. Observation years are not release dates. Figures for 2025 are WEO estimates; 2026–30 are outlook projections. The current account, GDP growth, savings, investment and export-volume series are IMF annual concepts. They are not MOTIE customs product lines, and this catalogue has no semiconductor-export series for Korea — the goods-and-services export value series is empty for Korea in the snapshot. Dong-a/MOTIE figures are reported claims, not re-computed here. MacroVedia pages linked above are the same IMF series; choose South Korea or Taiwan in the selector. Live values for the cited years matched this snapshot when checked. SVG rendering is not browser or mobile QA.
Research Date
The displayed date matches the related news edition. Research was completed 2026-09-10.
Related news: Daily · 2026-09-06
More Research
Pay Raises Are Back To 2019. The Hiring Boom Is Not.
July 2026 private hourly raises were the slowest in five years, but they match 2018–19. Hiring does not: private payrolls added about 53,000 jobs a month versus 177,000 in 2015–19.
Ukraine’s Real Economy Is Still A Fifth Smaller Than Before The Invasion
IMF accounts show Ukraine’s constant-price output still about a fifth below 2021, even as dollar GDP looks recovered.
Copper’s Record Was Already On The Books. Chile Still Runs A Deficit.
IMF annual copper was already at a record in 2025. Chile’s current account and budget were still in deficit.