LunarWeave
A Wind Giant On Land, A Rounding Error At Sea
The United States is not short of wind turbines. It is short of wind turbines in the water.
In August 2026 the federal government agreed to pay the German utility RWE $1.22 billion to give up offshore wind leases, the fifth such payout reported in this administration. The deal reads like the dismantling of an industry. The installed fleet says otherwise. By 2025 the United States had 171.3 megawatts of on-grid offshore wind — less than Japan, less than Denmark, and about one-ninety-ninth of the United Kingdom. The money is going to cancel ocean leases, not to buy out a working sea of turbines.
The country already builds wind at continental scale
On land, American wind is a mature business. IRENA records 158,655 megawatts of on-grid onshore capacity in the United States in 2025, against 592,620 MW in China, 68,135 MW in Germany and 16,431 MW in the United Kingdom. Add the tiny offshore slice and the U.S. on-grid wind total is 158,826.3 MW, matching IRENA’s combined wind series exactly.
Offshore accounts for 0.11 percent of that American fleet. In the United Kingdom, offshore is 51 percent of on-grid wind capacity — more capacity at sea (16,965 MW) than on shore (16,431 MW). Germany’s offshore share is 12 percent; China’s is 7.4 percent. The United States did not fail to industrialize wind. It industrialized it inland, then left the coast almost empty.
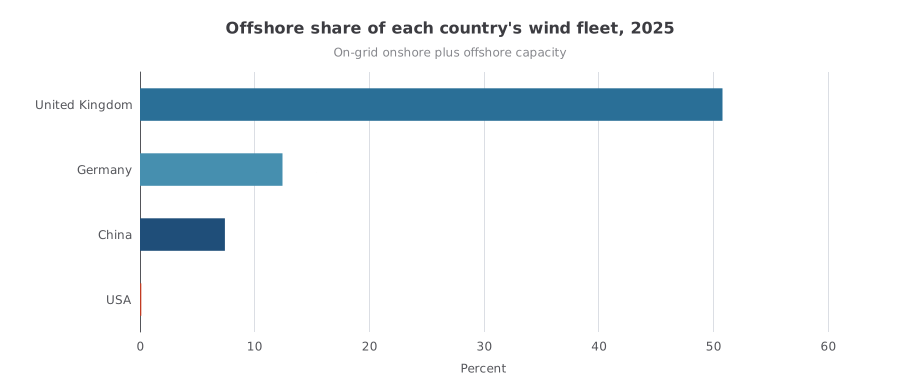
Offshore wind as a share of on-grid onshore plus offshore capacity in 2025. The U.K. figure uses the sum of those two IRENA series, not a separate official total. Source: IRENASTAT.
What 171 megawatts looks like next to everyone else
Capacity is not the same as electricity generated, and it is not a count of leased but unbuilt projects. It is the working stock. On that measure, 2025 on-grid offshore capacity was:
| Country | Offshore capacity (MW) | Multiple of U.S. |
|---|---|---|
| China | 47,390 | 277× |
| United Kingdom | 16,965 | 99× |
| Germany | 9,673 | 56× |
| Netherlands | 4,748 | 28× |
| Taiwan (IRENA: Chinese Taipei) | 3,587 | 21× |
| Denmark | 2,644 | 15× |
| Belgium | 2,262 | 13× |
| France | 1,902 | 11× |
| Japan | 285 | 1.7× |
| United States | 171.3 | 1× |
Denmark’s 2,644 MW is not a rounding error on a global league table; it is fifteen times the entire U.S. offshore stock. Belgium, with no claim to being a continental energy power, still has thirteen times as much. The American total would not fill a single large European project.
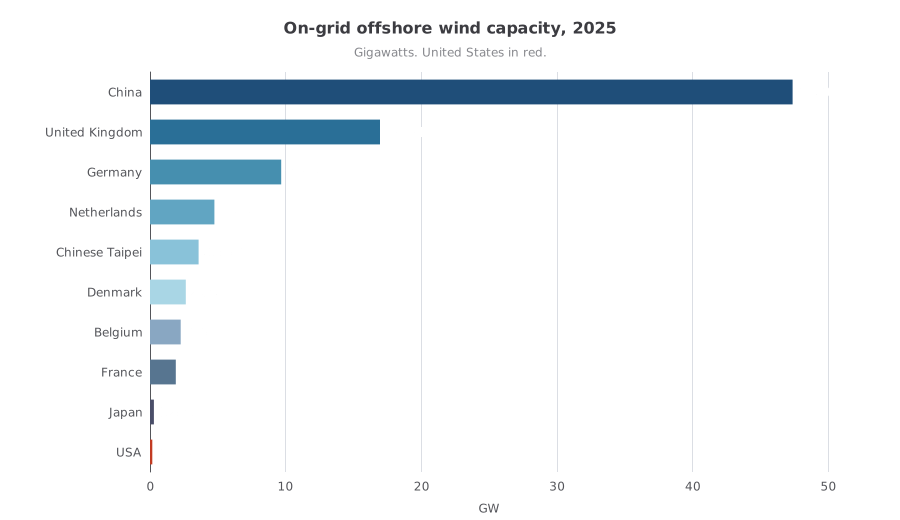
On-grid offshore wind electricity capacity in 2025, shown in gigawatts (1 GW = 1,000 MW). Only countries with saved IRENA observations are shown; this is not an official world total. Source: IRENA.
The United States did add a noticeable increment in 2024, when capacity rose from 41.3 MW to 171.3 MW and then held there in 2025. That is a real commercial start, not a statistical flicker: the series begins at 0.02 MW in 2014 and sits at 29 MW for several years after 2016. Quadrupling in one year still leaves the country behind Japan’s 285 MW.
The gap is old, not a one-year stall
European and Chinese build-out was already far along before the first U.S. megawatts appeared. In 2010, IRENA records 1,341 MW offshore in the United Kingdom, 868 MW in Denmark and 228 MW in the Netherlands. The U.S. series has no 2010 observation; its first recorded point is 2014. By 2025 China had climbed from 100 MW to 47,390 MW. The American line in that history is not a late surge that policy then reversed. It is a line that never left the axis.
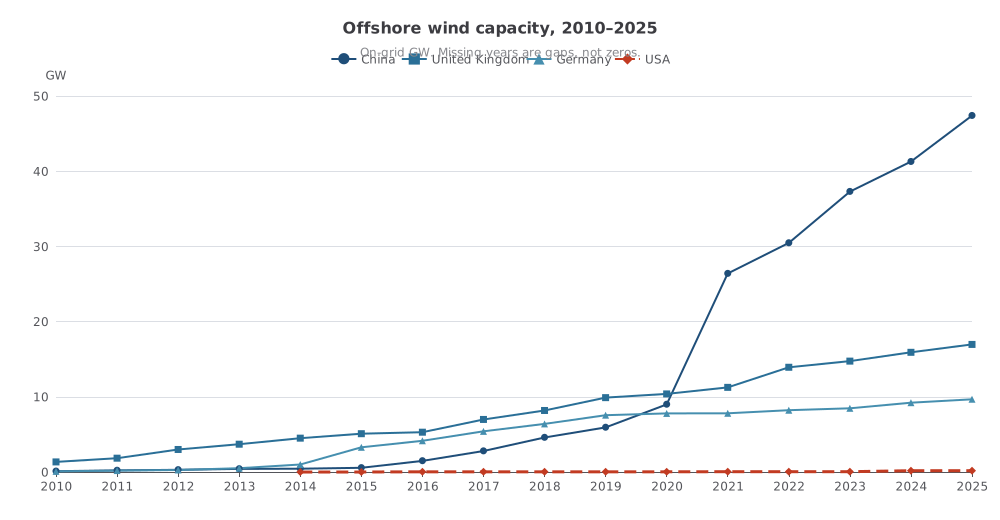
On-grid offshore capacity, 2010–2025. Years without an observation are gaps, not zeros; the U.S. series starts in 2014. Source: IRENASTAT.
That history matters for how to read the lease buyouts. Paying operators to walk away from unbuilt ocean acreage does not shrink a U.K.-sized fleet, because no such fleet exists in U.S. waters. It can still change the future: 171 MW is what got built, not what was permitted or financed. IRENA’s capacity files do not measure cancelled leases, pipeline gigawatts, or the $1.22 billion price tag. Those belong to the reporting. The statistics answer a narrower question: after a decade of U.S. offshore projects in the news, how much steel is actually in the water?
Very little. The United States already knows how to build wind at scale. It has done so on the Great Plains and the prairie grid, not on the Atlantic shelf. The RWE payment, and the four reported predecessors, are not the teardown of an incumbent offshore industry. They are a decision about whether one will be allowed to start.
Sources and methods
This article is retrospective. It uses IRENA data available in a 24 August 2026 snapshot, including 2025 annual observations, to examine news from 6 August 2026. Those later figures were not necessarily published on that day.
Capacity figures are IRENA’s on-grid electricity capacity in megawatts, retrieved as annual observations dated 1 January of each year. Onshore and offshore series are separate technologies; they are added only where both exist for the same country and year. For the United States in 2025 that sum equals IRENA’s combined on-grid wind series (158,826.3 MW). Off-grid capacity is excluded. Empty geographies were not treated as zero: IRENA’s country-scope offshore series has no World total in this snapshot, and the offshore generation series has no United States or United Kingdom rows, so generation is not compared. Taiwan appears in IRENA as Chinese Taipei.
The RWE payment and the claim that it was the fifth such deal are from Guardian reporting; they are not IRENA statistics and were not independently audited here. Capacity is not generation, not employment, and not a verdict on whether the leases would have been good investments.
Research Date
The displayed date matches the related news edition. Research was completed 2026-09-10.
Related news: Daily · 2026-08-06
More Research
The July Job Loss Was On Local School Payrolls
July 2026’s 23,000-job loss was real in later BLS data, but private payrolls still rose. Local public education accounted for almost all of the decline, on top of a year of stall-speed hirin
Ghana Locked The Cocoa Trees After The Beans’ Price Tripled
Ghana criminalized converting cocoa farms after world cocoa prices tripled in the IMF series — a spike the Fund already assumes will halve.
Russia’s Wartime Surplus Lasted One Year
IMF accounts show Russia’s 2022 current-account windfall collapsing by 2024, as export volumes fell and imports rebounded.