LunarWeave
The July Job Loss Was On Local School Payrolls
The first Friday in August delivered a number Washington could weaponize. Coverage of the Bureau of Labor Statistics employment report said U.S. payrolls fell by 23,000 in July 2026 — an unexpected loss after economists had looked for a gain, and a gift to anyone arguing that the expansion was already over. NBC News reported that the prior two months had also been revised down. RTÉ asked whether the Federal Reserve would still raise rates.
The headline was not a mirage. In the later Current Employment Statistics extract used here, seasonally adjusted total nonfarm employment still falls by 23,000 in July, to 158.86 million. What the headline does not say is which payrolls moved. Private employers added 30,000 jobs. Government cut 53,000. Almost all of that government decline was in local public education.
That split changes the interpretation. July was not a broad private hiring freeze. It was a noisy month in a labor market that has been near stall speed since 2025, with a concentrated drop in school employment large enough to push the total below zero.
A 23,000-job loss that private payrolls did not produce
Seasonally adjusted nonfarm payrolls are the sum of private and government jobs. In July those pieces moved in opposite directions:
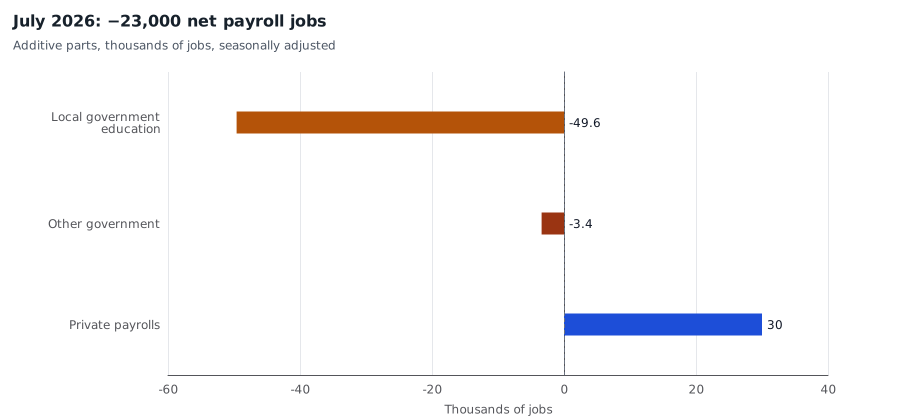
Seasonally adjusted change in U.S. payroll jobs, July 2026, thousands. Local government education (−49.6) plus other government (−3.4) plus private payrolls (+30.0) equals the −23.0 total nonfarm change. BLS Current Employment Statistics, snapshot of 24 August 2026; June and July 2026 are preliminary. Education is published in tenths of thousands; other government is residual government minus local education.
Local government education fell by 49,600 jobs. The rest of government, taken together, was down about 3,400. Private payrolls rose by 30,000. The three pieces add to the −23,000 headline.
Al Jazeera’s first-day summary pointed to declines in education, government and retail. The establishment survey backs two of those. Retail trade fell by 19,400. Manufacturing, often treated as the political thermometer, rose by 5,000; goods-producing jobs as a group rose by 25,000. Private service jobs still eked out a 5,000 gain even after the retail drop. The private sector as a whole did not contract.
Summer school calendars make seasonally adjusted local-education payrolls jumpy. Over the 37 Julys since 1990 in this extract, local government education has fallen in 11 of them; the July 2026 drop is larger than the July average, which is a gain, but it is not the largest on record. The series cannot say how much of the 49,600 is a genuine staffing cut and how much is leftover seasonal noise. It can say that without that education decline, July’s total would have been positive.
The labor market had already slowed to a crawl
July’s composition matters because the level of hiring had already collapsed relative to the post-pandemic rebound. Average monthly nonfarm gains were about 210,000 in 2023 and 122,000 in 2024. In 2025 they averaged 10,000. From January through July 2026 they averaged 61,000 — firmer than 2025, still a fraction of 2023.
Over the 12 months to July 2026, the United States added only 316,000 payroll jobs, 0.2 percent. The same 12-month gain was 794,000 to July 2025 and 1.71 million to July 2024. Private payrolls still rose by 631,000 over the latest year. Government fell by 315,000; federal employment alone was down 252,000. The year-long government decline is a different story from July’s school-payroll drop. October 2025, not July 2026, was the month when federal cuts dominated the total.
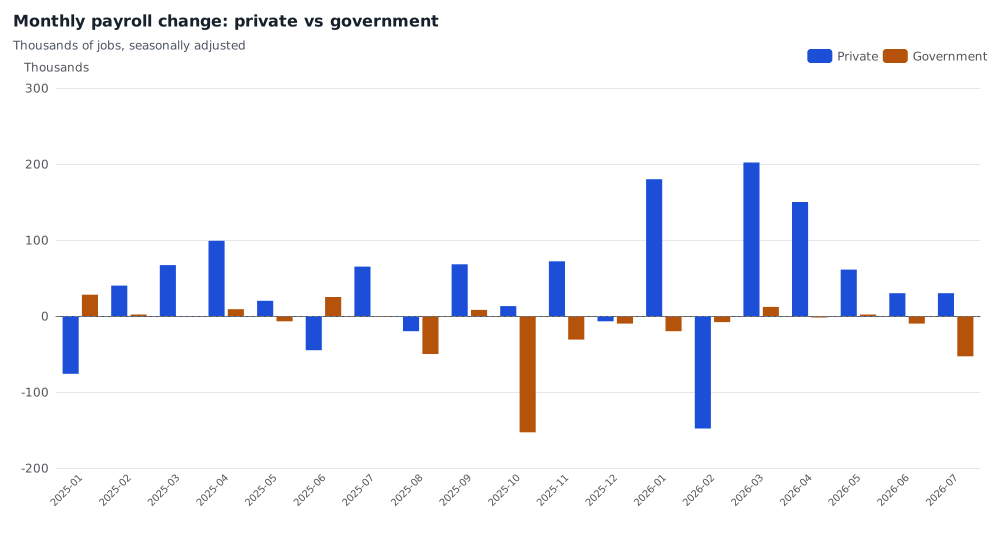
Monthly change in seasonally adjusted U.S. payroll employment, January 2025–July 2026, thousands of jobs. Private and government are additive parts of total nonfarm. BLS CES, snapshot of 24 August 2026; June and July 2026 preliminary.
Negative total-nonfarm months were rare in the 2010s expansion: five in 120 months. From January 2025 through July 2026 there were seven, including February 2026, when private payrolls fell by 148,000. July is not the break in the series. It is another month in which a government decline was large enough, against weak private gains, to flip the sign.
The Bureau’s own three-month average change — a smoother official series, not a homemade rolling mean — was +20,000 in July. Private payrolls averaged +40,000 over those three months. May through July together added 60,000 jobs, all of it from a 121,000 private gain set against a 61,000 government loss.
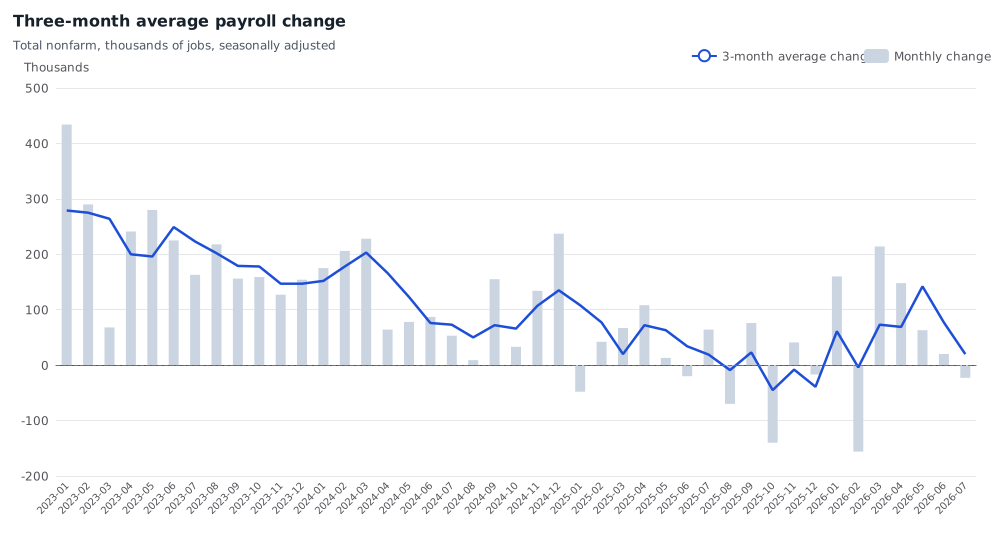
Official BLS three-month average change in seasonally adjusted total nonfarm payrolls (line) and the monthly change (bars), January 2023–July 2026, thousands of jobs. CES snapshot of 24 August 2026; June and July 2026 preliminary.
On the day of the report, NBC said May had been revised to +129,000 and June to +57,000. Those first-print revisions are reporting, not this extract. In the 24 August snapshot, May is +63,000 and June is +20,000. The later vintage makes the spring even softer. It does not change July’s −23,000, which remains preliminary.
Hours held; pay rose more slowly
If firms were dumping work, hours would usually sag before headcount. Average weekly hours of all private employees were 34.3 in July, a tenth of an hour above July 2025 and unchanged from April through June. That is not a collapse in labor demand. It is also not a surge.
Average hourly earnings were $37.62, up two cents from June and 3.2 percent from a year earlier. That pace is consistent with a cooling, not a re-accelerating, wage cycle — one reason a single negative payroll print is a weak basis for a rate decision by itself. This extract cannot speak to the household survey. It does not verify the reported 4.1 percent unemployment rate or the claimed drop in labor-force participation.
What the 23,000 should not be asked to prove
Payroll employment is a count of jobs on establishment surveys, not a census of people. Monthly changes are revised, sometimes sharply; June and July 2026 still carry preliminary flags. Local education in July is a seasonally difficult series. None of those caveats restore a private-sector contraction that is not in the data.
The useful reading of July is narrower, and more awkward for both triumphalism and panic. Private employers were still adding jobs, slowly. Government employment has been shrinking for a year, led by federal payrolls. In July, a large drop in local school jobs — whether staffing cut or seasonal leftover — was enough to turn a weak total negative. The labor market’s problem is the stall since 2025, not a one-month vanishing of private work.
Methods and sources
This is retrospective research completed on 10 September 2026 about a 7 August 2026 news cycle. Figures come from a pinned BLS Current Employment Statistics snapshot dated 24 August 2026, after the first release. They are not an as-of reconstruction of what was on the screen that Friday. Employment levels are thousands of seasonally adjusted jobs; monthly changes are first differences of those levels. Official source files are the CES bulk time series and the CES program page. Series used include CES0000000001 (total nonfarm), CES0500000001 (total private), CES9000000001 (government), CES9093161101 (local government education), CES0000000026 (three-month average change), CES4200000001 (retail trade), CES3000000001 (manufacturing) and CES9091000001 (federal). June and July 2026 observations are preliminary.
Research Date
The displayed date matches the related news edition. Research was completed 2026-09-10.
Related news: Daily · 2026-08-07
More Research
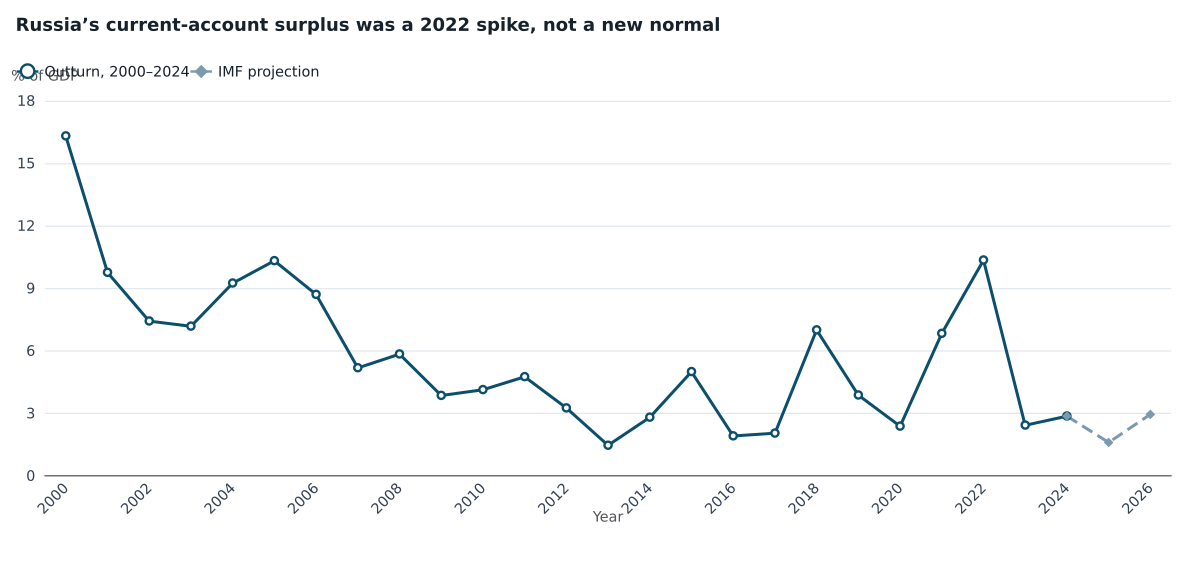
Russia’s Wartime Surplus Lasted One Year
IMF accounts show Russia’s 2022 current-account windfall collapsing by 2024, as export volumes fell and imports rebounded.
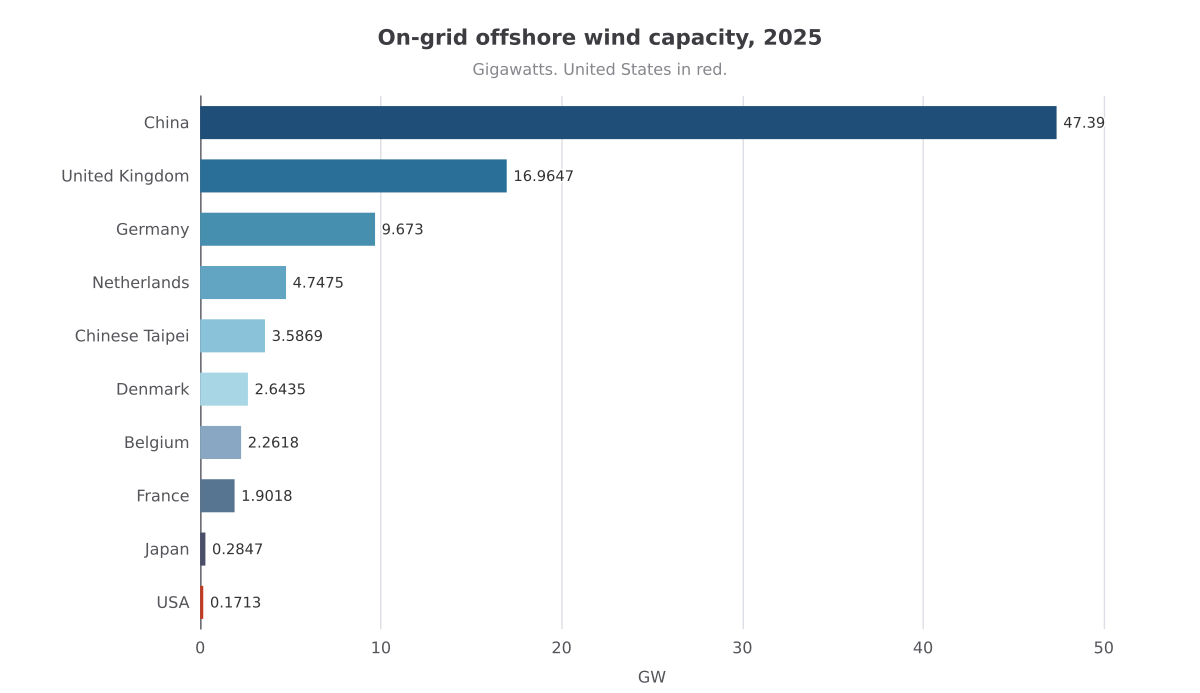
A Wind Giant On Land, A Rounding Error At Sea
IRENA capacity data show the United States had only 171 MW of offshore wind in 2025 — 0.11 percent of its wind fleet — so reported lease buyouts target an unbuilt ocean pipeline, not a worki
India Can Fill Half Its Grid With Non-Fossil Plants And Still Run On Coal
IRENA shows India’s solar-led capacity boom through 2025, while 2023 generation was still three-quarters coal.