LunarWeave
Russia’s Wartime Surplus Lasted One Year
The U.S. Senate voted 86–11 on a sanctions package designed, in Associated Press reporting, to squeeze countries that still buy Russian oil, gas and other exports. Coverage in India described a threat of 100% tariffs on buyers including India and China, with presidential discretion and ally exemptions. The political theory is straightforward: if the remaining customers pay a crushing U.S. tariff, Moscow’s war chest shrinks.
The external books already show something less straightforward. In the IMF World Economic Outlook, Russia’s current-account surplus — the gap between what the country earns from the world and what it pays it — did spike in the first year of the full-scale war. It did not stay there.
A windfall, then a snap-back
A current account is not an oil-export total. It nets goods and services trade against income and transfer flows, so a surplus can swell because exports fetch more, because imports collapse, or both. Even with that caveat, the 2022 print is unmistakable.
Russia’s current-account surplus as a share of GDP reached 10.4% in 2022. In dollars it was $238 billion, the largest annual surplus in this IMF series since 2000 and almost double the previous peak of $125 billion in 2021. Readers comparing countries on that page need to select Russia; the live figures for 2021–2024 match the snapshot used here.
Then the spike vanished. The surplus was 2.4% of GDP ($49 billion) in 2023 and 2.9% ($63 billion) in 2024 — a 7.5 point drop as a share of GDP, and 74% smaller in dollars. In 2019 it had been 3.9% of GDP, or $66 billion, already near the 2024 scale.
The share-of-GDP lens can mislead on its own. In 2000 the surplus was 16.3% of a much smaller economy, only $45 billion. The wartime event that stands out is the dollar mountain in 2022, not a permanently fatter external surplus.
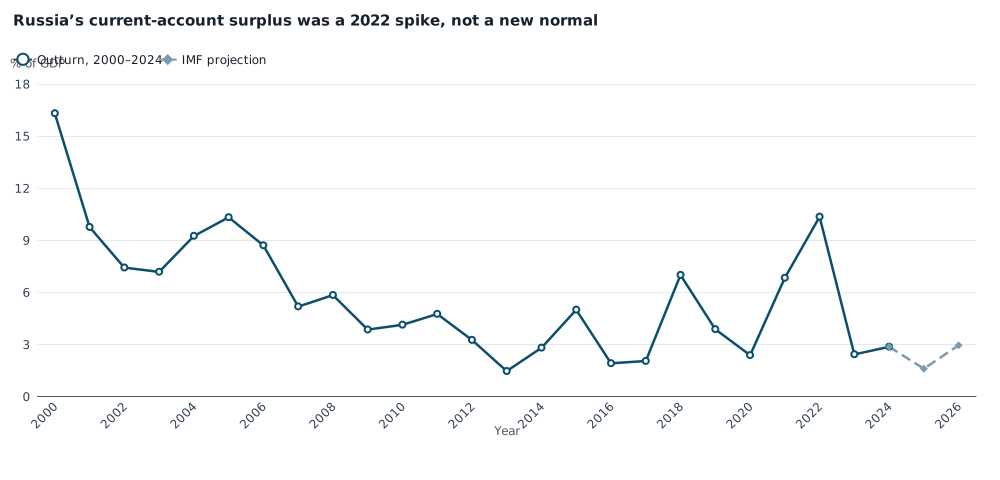
Russia current-account balance, percent of GDP. Annual IMF World Economic Outlook figures for 2000–2024 (solid) and staff projections for 2025–2026 (dashed). A current account is exports minus imports plus net income and transfers — not oil revenue. Source: IMF World Economic Outlook, series BCA_NGDPD. Choose Russia on the current-account ratio page.
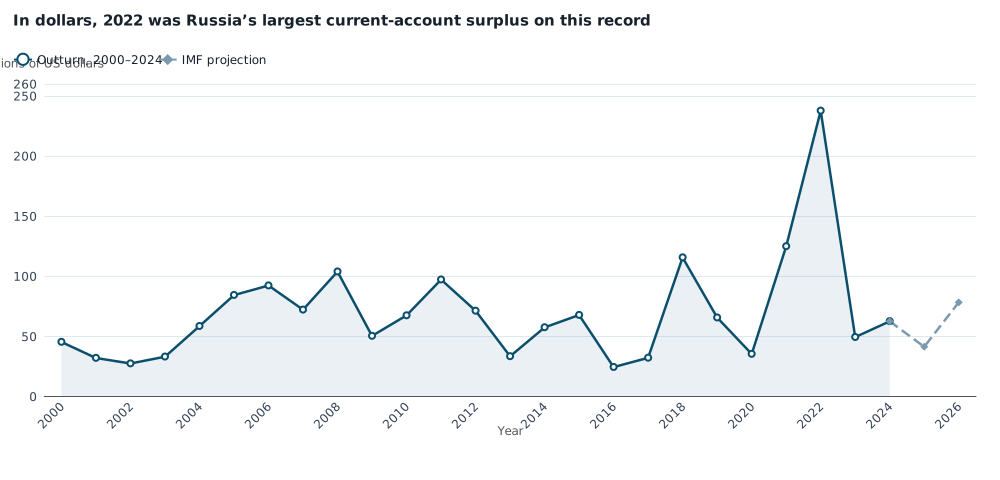
Russia current-account balance, billions of US dollars. Annual IMF figures for 2000–2024 (solid) and staff projections for 2025–2026 (dashed). Dollar GDP, and therefore the dollar surplus, also moves with the exchange rate. Source: IMF WEO, series BCA. Choose Russia on the dollar current-account page.
Exports shrank. Imports came back.
This dataset has no usable dollar series for Russia’s exports and imports of goods and services. It does publish volumes — quantity, stripped of price swings. That matters, because 2022 oil prices can inflate a surplus even while fewer goods leave the country.
Export volumes fell 8.4% in 2022, another 12.0% in 2023, and 1.8% in 2024. Compounded, that left the 2024 export-volume index about 21% below 2021. Goods-only volumes tell the same story: three consecutive declines.
Import volumes crashed 13.9% in 2022 — the sanctions-and-exit shock — then rose 7.8% in 2023 and 18.0% in 2024. By 2024 they were about 10% above the 2021 level. The 2022 surplus was a price-and-import-collapse event. What followed was falling export quantities and a rebound in what Russia bought from the world.
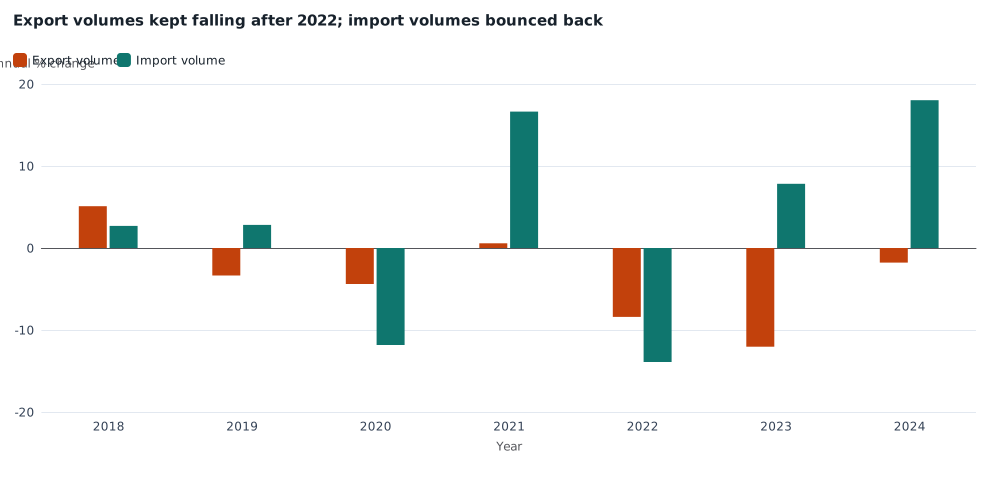
Annual percent change in the volume of Russia’s exports and imports of goods and services, 2018–2024. Volume is quantity, not dollar value, so it does not capture oil-price swings. Source: IMF WEO, series TX_RPCH and TM_RPCH.
That pattern does not identify how much of the missing export volume was oil, nor how much of the returning import volume was parallel trade through third countries. It does show that the external surplus of 2022 was not a durable new setting.
The war economy did not move in lockstep
A shrinking current account is not a shrinking war machine.
Real GDP contracted 1.4% in 2022, then expanded 4.1% in 2023 and 4.9% in 2024 — a domestic boom alongside a deflating external surplus. In this IMF vintage, real GDP growth then cools to 1.0% in the 2025 projection. Average consumer-price inflation, 13.7% in 2022, was still 8.4% in 2024.
The budget is the other open valve. General-government net lending was a deficit of 1.6% of GDP in 2024. IMF staff put 2025 at a 3.9% deficit, with spending at 39.1% of GDP — matching the 39.2% recorded in the pandemic year 2020. Revenue as a share of GDP did not collapse (35.1% in 2024). Public debt remained low by rich-country standards, at 14.8% of GDP in 2024. A wider deficit on a still-small debt stock is not a fiscal crisis. It is also not the 2022 external windfall paying for everything.
| Year | Current account, % of GDP | Current account, $bn | Export volume, % chg | Import volume, % chg | Real GDP, % chg | Budget balance, % of GDP |
|---|---|---|---|---|---|---|
| 2019 | 3.9 | 65.7 | −3.3 | 2.8 | 2.2 | 1.9 |
| 2020 | 2.4 | 35.4 | −4.4 | −11.8 | −2.7 | −4.0 |
| 2021 | 6.8 | 125.0 | 0.6 | 16.6 | 5.9 | 0.8 |
| 2022 | 10.4 | 237.7 | −8.4 | −13.9 | −1.4 | −1.3 |
| 2023 | 2.4 | 49.4 | −12.0 | 7.8 | 4.1 | −2.2 |
| 2024 | 2.9 | 62.6 | −1.8 | 18.0 | 4.9 | −1.6 |
| 2025* | 1.6 | 41.4 | 2.4 | 7.0 | 1.0 | −3.9 |
*2025 figures are IMF staff projections in this vintage, not outturns. Budget balance is general-government net lending/borrowing. Sources: IMF WEO series BCA_NGDPD, BCA, TX_RPCH, TM_RPCH, NGDP_RPCH, GGXCNL_NGDP.
What the bill can still hit — and what these numbers cannot say
None of this measures barrels sold to India or China, or how much of those countries’ exports would face a U.S. tariff. A surplus can shrink while oil still funds the treasury, if imports recover faster than export earnings fade.
What the IMF series can say is narrower, and still material. The surplus that made 2022 look like a new petro-state bonanza is gone. Export volumes have been falling for three years; imports have more than recouped their 2022 collapse. Staff projections do not put the 10% of GDP surplus back in 2025 or 2026. If the bill is meant to tax a still-swollen windfall, it is late for that windfall. If it is meant to grind down what remains, that remainder is real — just no longer extraordinary.
Sources and methods
This is retrospective research dated 10 September 2026, using a pinned IMF World Economic Outlook snapshot, for reporting from 8 August 2026. Later data were not available that day and are not presented as if they were. The extract does not flag which years the Fund treats as estimates; years through 2024 are treated here as historical outturns, and 2025–2031 as staff projections. From 2028 the growth path is exactly 1.0% and inflation exactly 4.0%, a sign those later years are placeholders rather than a detailed forecast.
Figures are annual. The current-account identity was checked: each year’s surplus as a share of GDP times dollar GDP recovers the dollar surplus. Trade volumes are percent changes, not levels, and cover goods and services unless labelled as goods only. Dollar GDP and dollar current-account totals move with the ruble as well as with real activity. IMF wartime statistics for Russia carry extra uncertainty. Charts were rendered to SVG; that is not a browser or mobile layout check.
Official source: IMF World Economic Outlook database.
Research Date
The displayed date matches the related news edition. Research was completed 2026-09-10.
Related news: Daily · 2026-08-08
More Research
India Can Fill Half Its Grid With Non-Fossil Plants And Still Run On Coal
IRENA shows India’s solar-led capacity boom through 2025, while 2023 generation was still three-quarters coal.
The July Job Loss Was On Local School Payrolls
July 2026’s 23,000-job loss was real in later BLS data, but private payrolls still rose. Local public education accounted for almost all of the decline, on top of a year of stall-speed hirin
Colombia’s New Government Inherits A Stalled Economy And A 6 Percent Budget Hole
Colombia’s new government promised a cartel war just as a magnitude-7.4 earthquake hit. IMF accounts show growth already stalled and the budget deficit back near 6 percent of GDP; a $1bn US