LunarWeave
America's Expansion Was Spread Across States — And Concentrated In A Few Industries
The Commerce Department’s advance estimate for the third quarter of 2026 put U.S. real GDP up at a 3.4% annualized pace, which news reports framed as resilient households and an artificial-intelligence spending spree offsetting costlier oil. That print is an expenditure-side snapshot of July through September. The production accounts that show which industries and which states were actually generating output run a quarter behind.
Those accounts, through June, already had a shape. Growth was geographically common and industrially lopsided. A small information sector — software, data processing, telecommunications, publishing, and related services — did about a quarter of the work. Durable-goods factories did almost as much in the spring. Construction, the industry that would register a wave of data-center building, barely registered. The states that shrank were energy states.
A 6 percent industry did a quarter of the growth
In 2026 Q2, BEA’s quarterly GDP-by-state accounts put U.S. real GDP up 2.2% at an annual rate. That is the same second-quarter pace the third-quarter news cited as the jumping-off point. Year over year, real output was also up 2.2%.
Information contributed 0.52 percentage point of that 2.2% — 24% of the quarter’s growth — even though it was only 5.9% of current-dollar GDP. Durable-goods manufacturing added another 0.50 point. Together they accounted for 46% of Q2 growth. Real output in information was 10.3% higher than a year earlier; in durables, 6.2% higher.
That is not the same thing as “AI.” The information sector includes motion pictures and phone companies as well as software publishers and data-processing firms. Durable manufacturing includes cars, machinery, and computers, not a line item for imported graphics processors. The third-quarter reports that credit equipment investment are describing purchases, including imports. These production numbers describe what domestic industries produced.
They still answer a useful question. If the expansion were mainly new buildings, construction would be doing the lifting. It added 0.14 point in Q2. If it were oil, mining would be doing it. Mining subtracted 0.12 point. Retail trade, the value added of stores rather than household spending, subtracted 0.27 point.
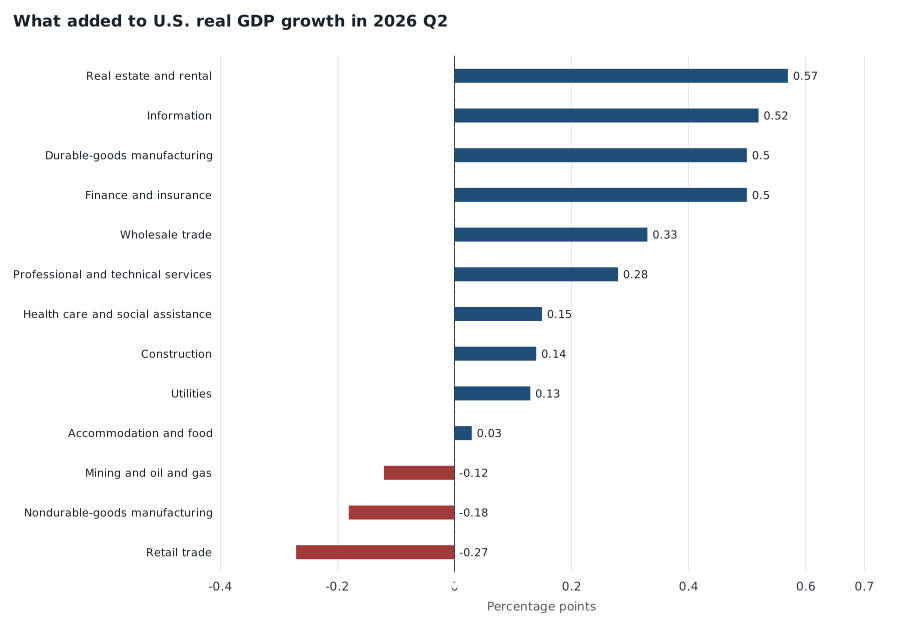
Industry contributions to the 2.2% annualized change in U.S. real GDP in 2026 Q2, in percentage points, seasonally adjusted. Information and durable-goods factories each added about 0.5 point. Real estate and finance were also large that quarter. Construction added 0.14 point; retail trade and mining subtracted. BEA SQGDP11, United States. Not every industry is shown, so the bars need not sum to 2.2.
Q2 was not a one-industry story. Real estate and rental added 0.57 point that quarter, and finance and insurance added 0.50 — as large as durables. Over the four quarters ended in June, though, information was the most consistent engine: 0.57 point a quarter on average, against a 2.2% average pace of growth. Finance averaged 0.50. Durables averaged 0.36 and arrived in bursts. Real estate averaged only 0.23, because it had nearly stalled in late 2025. Construction averaged 0.04.
| Industry | 2026 Q2 (pp) | Four-quarter average (pp) |
|---|---|---|
| Information | 0.52 | 0.57 |
| Finance and insurance | 0.50 | 0.50 |
| Durable-goods manufacturing | 0.50 | 0.36 |
| Real estate and rental | 0.57 | 0.23 |
| Construction | 0.14 | 0.04 |
| Mining | −0.12 | −0.06 |
| Retail trade | −0.27 | −0.04 |
The first quarter of 2026 was even more tilted: information contributed 0.85 point of a 2.5% pace — 34% of growth — while construction subtracted 0.02 point.
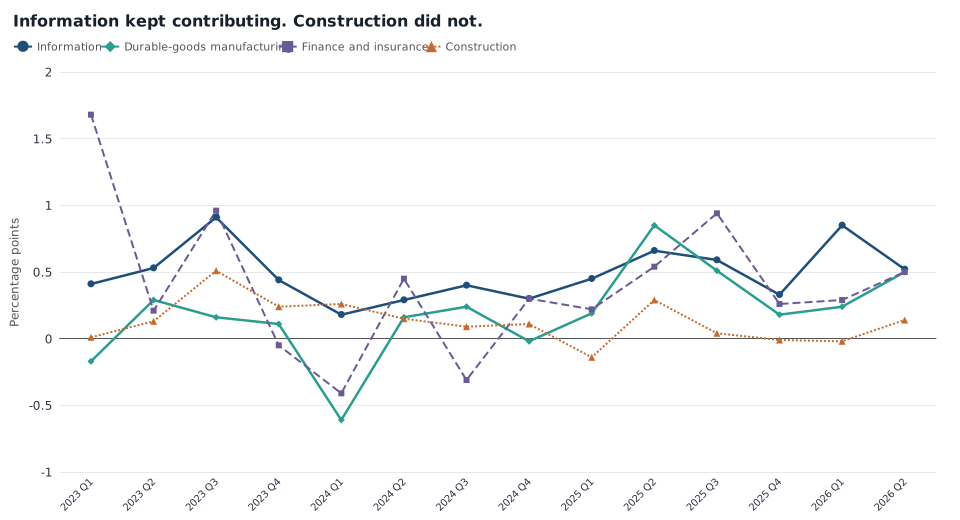
Contributions to annualized quarter-over-quarter U.S. real GDP growth, 2023 Q1–2026 Q2, in percentage points, seasonally adjusted. Information stayed positive. Construction hovered near zero. BEA SQGDP11.
Forty-four states grew. The ones that did not were energy states.
The industrial concentration did not require a handful of coastal states to carry the country. In 2026 Q2, 44 of 50 states had positive annualized real GDP growth. Those 44 accounted for 97.5% of the 50 states’ current-dollar GDP. The median state grew 1.7%, a little slower than the national 2.2%, because several large states were faster: New York at 4.0%, Florida at 3.0%, California at 2.5%.
Information contributed positively in 49 of 50 states. The exception was Washington, at −0.02 point, with overall growth of only 0.6%. Durable-goods manufacturing contributed positively in every state. Georgia’s information contribution (1.11 points) and California’s (1.10) were the largest, and each was a sizable share of that state’s growth. The impulse was still national, not a California-only event.
The six states that contracted were Nebraska (−0.1%), Kansas (−0.6%), North Dakota (−0.9%), Alaska (−1.3%), Wyoming (−1.6%), and West Virginia (−2.3%). Four of those six are oil, gas, or coal states. That pattern was already in the second-quarter books. It does not measure the late-October tanker fires in the Strait of Hormuz, and it is not a forecast of what higher oil prices will do to consumers. It does show that the production-side expansion through June was not an energy boom.
What this does not settle
The 3.4% third-quarter figure is a different account, for a later quarter, published as an advance estimate. Nothing here confirms or contradicts that number. Equipment investment can surge in the national accounts while showing up as imports rather than as U.S. factory output. Household consumption can rise while retail-trade GDP, which measures stores’ value added, falls.
Chained-dollar GDP by state does not sum exactly to U.S. GDP; national totals in this article use the published United States geography, not a sum of states. Contributions are to annualized quarter-over-quarter growth of seasonally adjusted real GDP, not shares of the level of the economy.
The useful conclusion is narrower, and it was already visible before the 3.4% print. Through mid-2026 the United States was still expanding in almost every state. The industries doing disproportionate work were information and, in bursts, durable-goods factories — not construction and not mining. A nationwide expansion can still be a narrow one.
Sources and methods
Figures are from the U.S. Bureau of Economic Analysis quarterly GDP-by-state tables (SQGDP9 real GDP in millions of chained 2017 dollars at a seasonally adjusted annual rate; SQGDP11 contributions to percent change), September 30, 2026 regional release, as stored in a snapshot used on 30 October 2026. The latest period in that snapshot is 2026 Q2. The 3.4% 2026 Q3 national figure is the BEA advance estimate as reported on 29 October 2026; it is not in these files. This is retrospective research with a later-available regional snapshot, not a reconstruction of what was known on 29 October 2026. Official documentation: BEA regional methodology and GDP by state. Charts are SVG renders of ECharts options; they were not separately tested in a browser layout.
Research Date
The displayed date matches the related news edition. Research was completed 2026-10-30.
Related news: Daily · 2026-10-29
More Research
The U.S. Elderly Passed Young Children In 2023 — If “Children” Means Under 15
Census 2023 middle-series projections show U.S. people 65+ overtaking ages 0–14 in 2023 — the same comparison China was reported to have crossed in 2025 — while under-18s remain more numerou
The Information Boom Is In Output, Not In California Payrolls
US information-sector output was still rising several times faster than the whole economy in mid-2026, while California information payrolls were already 19 percent below their 2022 peak.
Microsoft’s 60,000-Person Offer Is Almost The Size Of Seattle’s Software Payroll
Microsoft’s 60,000-person voluntary-exit pool is 92 percent as large as Seattle-area software-publishing employment, a payroll already 16.6 percent below its 2022 peak even as Washington inf