LunarWeave
The U.S. Elderly Passed Young Children In 2023 — If “Children” Means Under 15
China’s statistical office, as reported by Reuters in late October 2026, recorded a first: more people aged 65 and older than children under 15. The comparison is the standard three-way split demographers use worldwide — ages 0–14, 15–64, and 65+ — and it is meant to mark a society that now has more old-age dependents than children.
The United States is often described as the rich country that stays young, mainly because it still adds people through immigration. That reputation survives only if “children” means everyone under 18. Apply the same 0–14 versus 65+ test that China just failed, and the U.S. Census Bureau’s 2023 national projections show America crossing the line two years earlier.
Those figures are the Bureau’s main middle series, not later population estimates. Even the 2022–2025 values in the file are projections. A subsequent immigration surge could have added younger residents and delayed the crossover in later Census estimates; this dataset cannot check that. What it can show is the path the Bureau published in November 2023, and that path is unambiguous.
The same comparison, already crossed
In the middle series, 2022 is the last year in which children ages 0–14 outnumber people 65 and older: 59.4 million against 57.8 million, a lead of 1.6 million. In 2023 the lines swap. People 65+ reach 59.7 million; ages 0–14 fall to 58.8 million. The new elderly lead is 0.86 million.
By 2025 — the year China was reported to have made the turn — the U.S. gap is no longer close. The projections put 63.3 million people at 65+ and 58.0 million at ages 0–14. In 2026 the figures are 65.1 million and 57.7 million: an elderly lead of 7.4 million people.
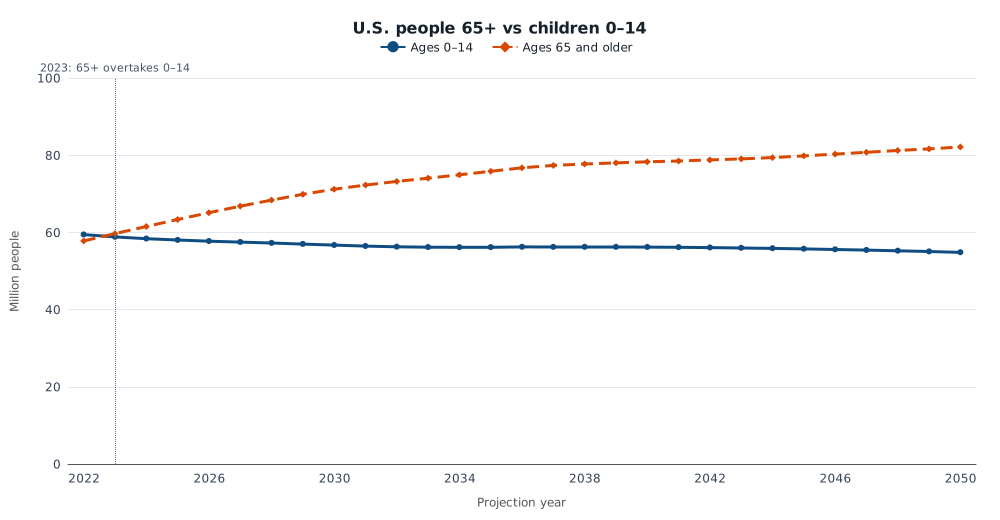
Projected U.S. resident population, million people, 2022–2050. Ages 0–14 (solid) versus 65 and older (dashed). The Census Bureau’s 2023 middle series first shows 65+ larger than 0–14 in 2023. These are projections, including the 2022–2025 values, not later Census counts. Source: U.S. Census Bureau, 2023 National Population Projections, main middle series.
The arithmetic behind the swap is lopsided. From 2022 to 2026 the 65+ population rises by 7.3 million. Ages 0–14 fall by 1.7 million. Working-age adults, 15–64, add only 0.6 million. The country’s projected total grows by 6.2 million people, and the entire net increase is more than accounted for by people already past 65.
The remaining buffer is ages 15–17
American conversation usually counts children as under 18. On that definition the country is not there yet. In 2026 the middle series still has 70.4 million people ages 0–17, about 5.2 million more than the 65.1 million who are 65+. Roughly 12.6 million of those “children” are 15, 16 or 17 — old enough to be in high school, and the only reason the broader child count still wins.
That buffer expires quickly. In 2028 under-18s still lead, 69.6 million to 68.4 million. In 2029 people 65+ overtake them: 69.9 million against 69.3 million. After that the elderly lead widens every year in the file.
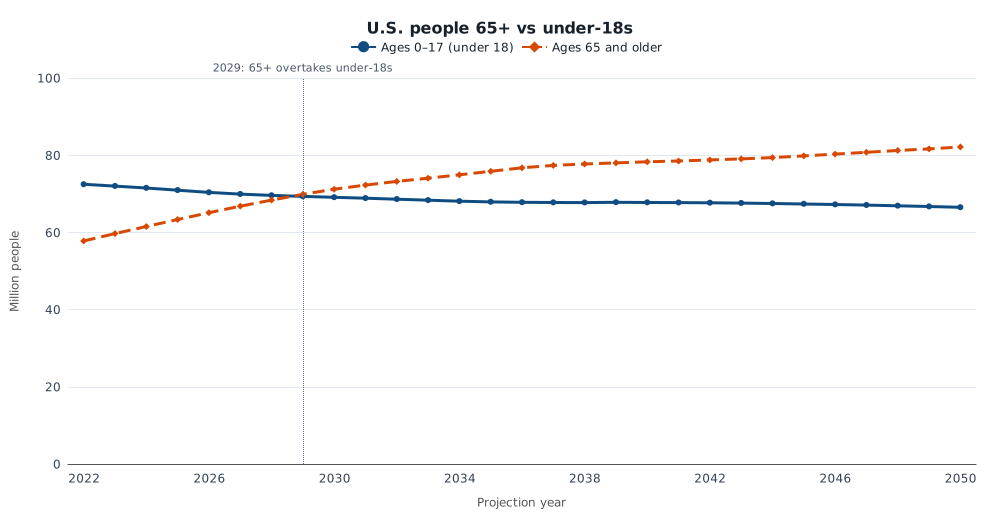
Projected U.S. resident population, million people, 2022–2050. Ages 0–17 (solid) versus 65 and older (dashed). Under-18s remain more numerous until 2029 in the same middle series. Projections, not later Census counts. Source: U.S. Census Bureau, 2023 National Population Projections.
The distinction is not a trick of rounding. It is a statement about which ages still look like a childhood population. If the question is “are there more retirees than elementary- and middle-school-age children?”, the Census file answered yes in 2023. If the question is “are there more retirees than minors?”, it answers yes in 2029.
| Year | Ages 0–14 | Ages 65+ | Under 18 | Ages 15–64 | Total | 65+ share |
|---|---|---|---|---|---|---|
| 2022 | 59.4 | 57.8 | 72.5 | 216.1 | 333.3 | 17.3% |
| 2023 | 58.8 | 59.7 | 72.0 | 216.4 | 334.9 | 17.8% |
| 2026 | 57.7 | 65.1 | 70.4 | 216.7 | 339.5 | 19.2% |
| 2029 | 57.0 | 69.9 | 69.3 | 216.9 | 343.8 | 20.3% |
| 2050 | 54.8 | 82.1 | 66.5 | 223.7 | 360.6 | 22.8% |
| 2100 | 49.5 | 106.3 | 59.9 | 209.8 | 365.6 | 29.1% |
Million people, U.S. Census Bureau 2023 middle-series projections. Shares are of the projected total. Totals may not sum because of rounding.
A slow-motion working-age squeeze
Headcounts make the crossover vivid. Shares show why it lasts. In 2022, 64.8% of the projected population is 15–64, 17.8% is 0–14, and 17.3% is 65+. By 2026 those shares are 63.8%, 17.0% and 19.2%. By 2050, 62.0%, 15.2% and 22.8%. By 2100, working-age adults are 57.4% of the population, children 0–14 are 13.5%, and people 65+ are 29.1%.
The working-age group does not collapse. It barely grows to mid-century — 216.1 million in 2022, 223.7 million in 2050 — and then shrinks. In 2100 the projections have 209.8 million people ages 15–64, 6.3 million fewer than in 2022, even though the total population is 32 million larger. People 65+ more than offset that: 57.8 million in 2022, 82.1 million in 2050, 106.3 million in 2100.
Old-age dependency — people 65+ per 100 people ages 15–64 — rises from 26.8 in 2022 to 30.0 in 2026, 36.7 in 2050, and 50.7 in 2100. At the end of the century the middle series has just over one person 65 or older for every two working-age adults. Child dependency moves the other way, from 27.5 children 0–14 per 100 working-age adults in 2022 to 23.6 in 2100.
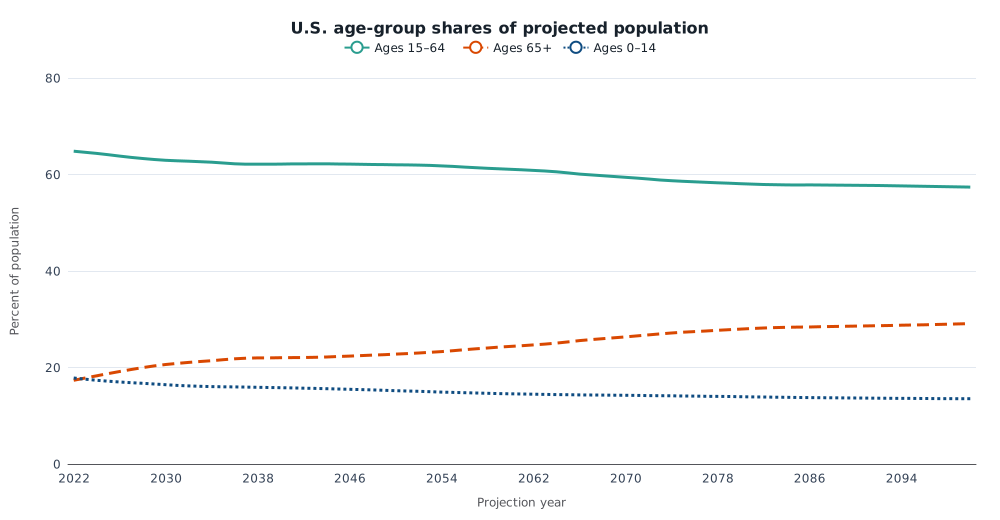
Share of projected U.S. population, percent, 2022–2100, for ages 0–14, 15–64 and 65+. The three groups sum to 100 percent. Source: U.S. Census Bureau, 2023 National Population Projections, main middle series.
None of this is a forecast of pension insolvency, health-care costs, or labour shortages. Dependency ratios count people, not workers, taxpayers, or patients. Plenty of 15–64-year-olds are not employed; plenty of people 65+ still are. The ratios only describe the age structure the middle series puts on the page.
What the comparison does not settle
China’s reported 2025 turning point and the U.S. projection are not the same kind of fact. The China figure comes from news reports of National Bureau of Statistics data — more than 223 million people 65+, exceeding children under 15 — and is not independently checked here. The U.S. figures are a single published projection series, the main middle path, covering the resident population by single year of age. Alternative Census scenarios with higher or lower immigration are not in this file, so the 2029 under-18 date should not be treated as a confidence interval.
The 2023 vintage also cannot tell us whether the United States has already lived the 2023–26 segment. Census population estimates released after November 2023, especially those that captured higher immigration, could show a larger child and working-age population than this middle series assumed. If they do, the 0–14 crossover may have arrived later than 2023, or not yet. The under-18 crossover in 2029 is likewise a projection, not a date on the calendar.
What the file does settle is narrower, and still worth knowing. The aging milestone now being treated as historic in China is not a distant American problem on the Census Bureau’s own central path. For young children, the Bureau already had the United States on the far side of that line. The extra years of “youth” in the American numbers are teenagers.
Sources and methods
This is retrospective research completed on 29 October 2026, using a pinned copy of the Census Bureau’s 2023 National Population Projections (main middle series, file np2023_d1_mid, released 9 November 2023). The digest date of the news that prompted the question is 28 October 2026. Later Census estimates and the Bureau’s alternative projection scenarios were not used.
National totals are both sexes, all races, and total Hispanic origin. Age groups are sums of single-year ages; age 100 is 100 and over. Ages 0–14, 15–64 and 65+ add to the published total in every year. Values are annual projection years 2022–2100 as stored in the period dictionary, in persons. China’s 2025 comparison is attributed to Reuters reporting as carried by Rzeczpospolita and is not verified from Chinese statistical microdata.
Research Date
The displayed date matches the related news edition. Research was completed 2026-10-29.
Related news: Daily · 2026-10-28
More Research
The Information Boom Is In Output, Not In California Payrolls
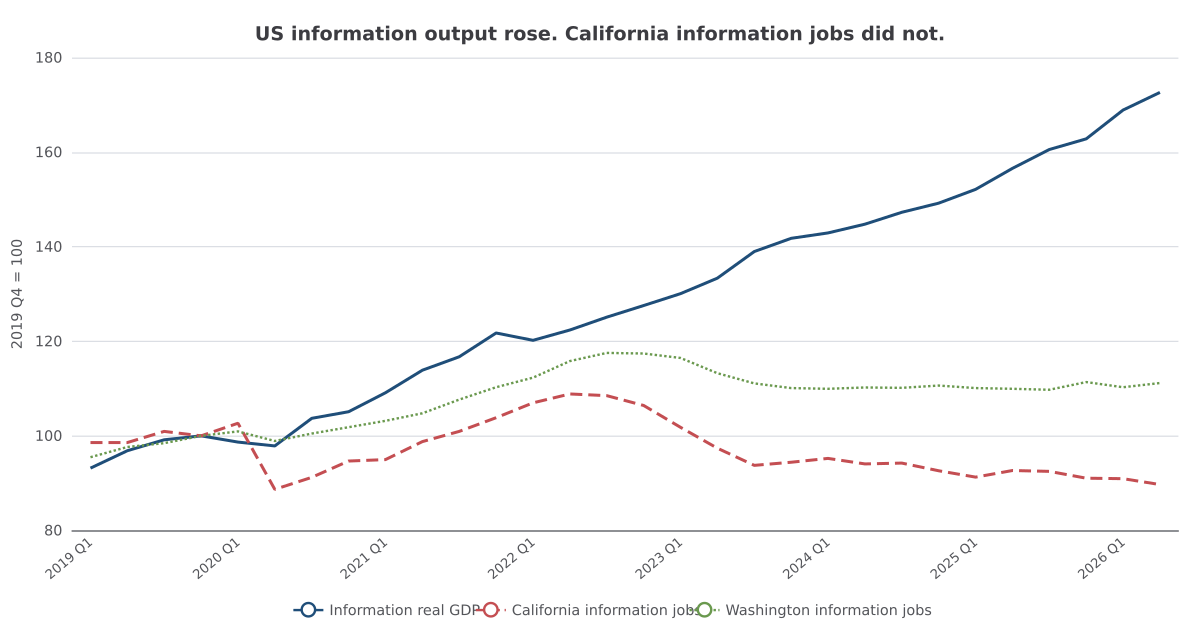
US information-sector output was still rising several times faster than the whole economy in mid-2026, while California information payrolls were already 19 percent below their 2022 peak.
Microsoft’s 60,000-Person Offer Is Almost The Size Of Seattle’s Software Payroll
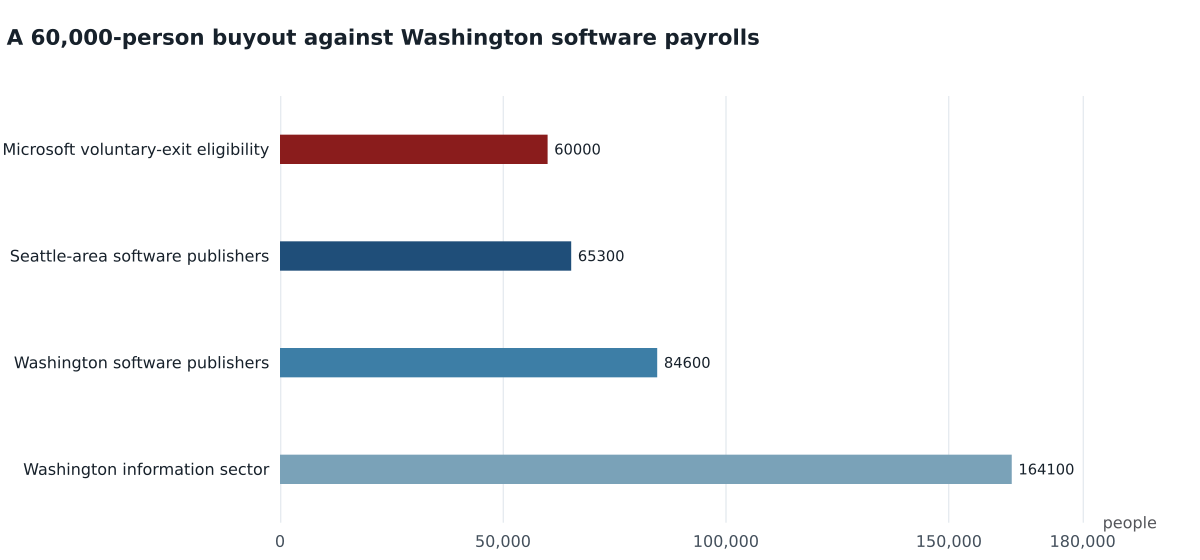
Microsoft’s 60,000-person voluntary-exit pool is 92 percent as large as Seattle-area software-publishing employment, a payroll already 16.6 percent below its 2022 peak even as Washington inf
Georgia Already Builds Cars. Audi Is Joining A Small, Rebuilt Industry.
Georgia’s motor-vehicle industry collapsed in 2009 and came back. Audi’s $4 billion plant is large for that rebuilt, still-small auto state.