LunarWeave
Solar Has Already Passed US Coal On The Grid
In July 2026 the Trump administration was accused of spending taxpayer money to cancel wind projects and keep coal plants running. The Guardian reported $2.7 billion directed against wind power and $1.125 billion into coal, and quoted critics who said household bills would rise. Those dollar figures and the bill claim are reporting, not numbers this article can verify.
The more stubborn fact sits underneath the argument. The United States no longer runs a coal grid that a few extra plants could restore. Over a quarter-century, coal has lost its place as the system’s main source of electricity. Natural gas took that role. Wind and solar, from almost nothing, now rival remaining coal capacity — and solar has already overtaken it. A policy that tries to revive coal and freeze wind is pushing against that inherited mix, not against a snapshot of 2000.
Capacity has already crossed
IRENA compiles annual on-grid electricity capacity. In 2000 the United States had 321.1 gigawatts of coal and 2.4 GW of wind. By 2025 coal was down to 171.3 GW, a 47% decline, while wind had risen to 158.8 GW — 93% of what coal still had left.
Solar moved faster. On-grid solar capacity was 0.6 GW in 2000. It reached 177.6 GW in 2024, edging past coal’s 175.7 GW that year, and 211.6 GW in 2025. Gas, which the political fight barely names, is in another league: 513.9 GW in 2025, about three times remaining coal.
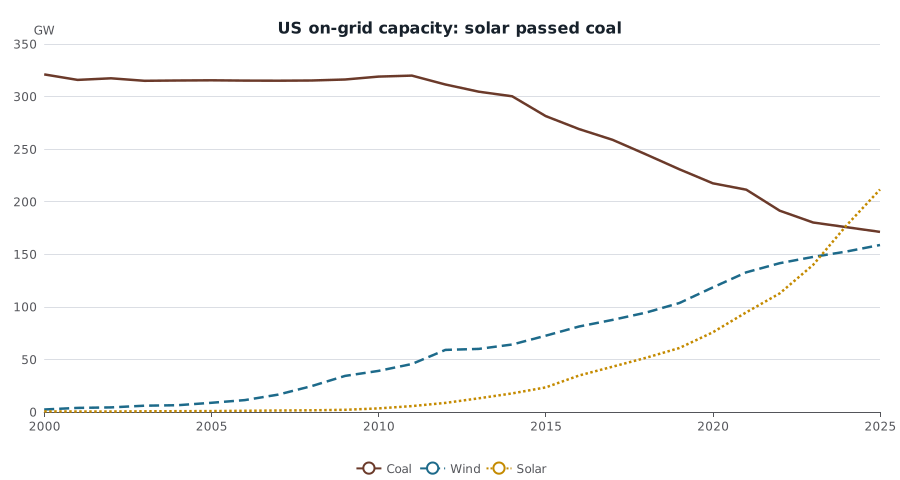
On-grid electricity capacity in the United States, gigawatts, 2000–2025. IRENA annual figures. Solar overtook coal in 2024; wind reached 93% of remaining coal capacity in 2025. Capacity is not generation: coal plants still produced more electricity than wind or solar in 2023, the latest generation year in this snapshot. Natural gas capacity (514 GW in 2025) is omitted so the coal–wind–solar crossing remains readable.
The wind in those headlines is not the wind already on the plains. Almost all US wind capacity is onshore: 158.7 GW in 2025. Offshore wind was 171.3 megawatts — a thousand times smaller than remaining coal capacity, and 0.11% of onshore wind. Paying to cancel offshore projects can still change what gets built next. It does not unwind the onshore fleet that is already there.
Generation tells a slower story — and a gas story
Capacity is a stock of plants. Generation is what those plants actually produced. IRENA’s generation series run only through 2023 in this snapshot, and coal is labelled coal and peat (peat is trivial in the United States, but it is not a coal-only code). Those figures are IRENA’s accounting, not the Energy Information Administration’s net generation, so they should not be mixed with EIA totals.
On that basis, coal generated 2,129 terawatt-hours in 2000, 52.5% of US electricity. In 2023 it generated 742 TWh, 16.7% of the total. That is a 65% drop in coal’s output, even though total generation only rose from 4,053 TWh to 4,453 TWh.
Gas filled the hole. It generated 634 TWh in 2000 (15.7%) and 1,865 TWh in 2023 (41.9%). Gas overtook coal in 2016 and has been the largest source since. Nuclear barely moved: 798 TWh in 2000, 808 TWh in 2023, about 18% of the mix.
Wind and solar grew from rounding errors into a real slice, without yet matching leftover coal output. Wind (onshore plus offshore) generated 5.7 TWh in 2000 and 426 TWh in 2023 — 9.6% of generation, almost all of it onshore. Solar photovoltaic generated 214 TWh, 4.8%. Together they reached 640 TWh, still short of coal’s 742 TWh. Offshore wind contributed 0.6 TWh, 0.013% of US generation.
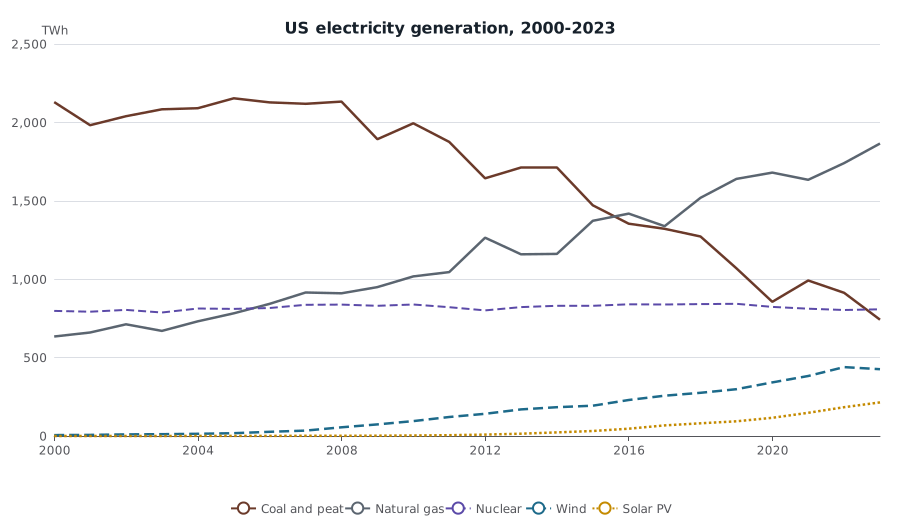
Electricity generation in the United States, terawatt-hours, 2000–2023. IRENA annual figures. Coal is IRENA’s coal-and-peat series. Wind is onshore plus offshore. Solar is photovoltaic. Gas overtook coal in 2016 and supplied 42% of generation in 2023; coal’s share fell from 53% to 17%. These IRENA totals are not the same as US EIA net generation.
| Source (IRENA) | 2000, TWh | 2000 share | 2023, TWh | 2023 share |
|---|---|---|---|---|
| Coal and peat | 2,129 | 52.5% | 742 | 16.7% |
| Natural gas | 634 | 15.7% | 1,865 | 41.9% |
| Nuclear | 798 | 19.7% | 808 | 18.1% |
| Wind | 5.7 | 0.1% | 426 | 9.6% |
| Solar PV | 0.2 | ~0% | 214 | 4.8% |
| All renewables | 330 | 8.2% | 962 | 21.6% |
| Total (renewable + non-renewable) | 4,053 | 100% | 4,453 | 100% |
Wind and solar PV sit inside “all renewables.” The listed rows are not a complete additive partition; hydro, oil, biomass and other sources are omitted.
The gap between capacity and generation is not a trick. In 2023 each megawatt of coal capacity produced more electricity than each megawatt of wind or solar — about 4,100 full-load hours for coal, 2,900 for wind, 1,500 for solar PV, if one simply divides that year’s output by that year’s installed stock. That is why solar can lead coal in gigawatts and still trail it in terawatt-hours. It is also why 2024–2025 capacity cannot be read as 2024–2025 generation: IRENA has not published those generation years in this snapshot.
All renewables together — hydro, wind, solar, biomass and the rest — supplied 21.6% of generation in 2023. That is larger than coal, and still smaller than gas.
The workforce shrank with the plants
Coal’s remaining role in electricity is already a rump. The mining payroll is smaller still. The Bureau of Labor Statistics counts US coal-mining employment in the Current Employment Statistics (series CES1021210001). In this seasonally adjusted national series, which begins in January 1985, jobs peaked at 178,300 that April. They recovered only to 89,700 in January 2012, then fell again. In July 2026 the count was 38,300 — 79% below the 1985 peak and 57% below that 2012 rebound.
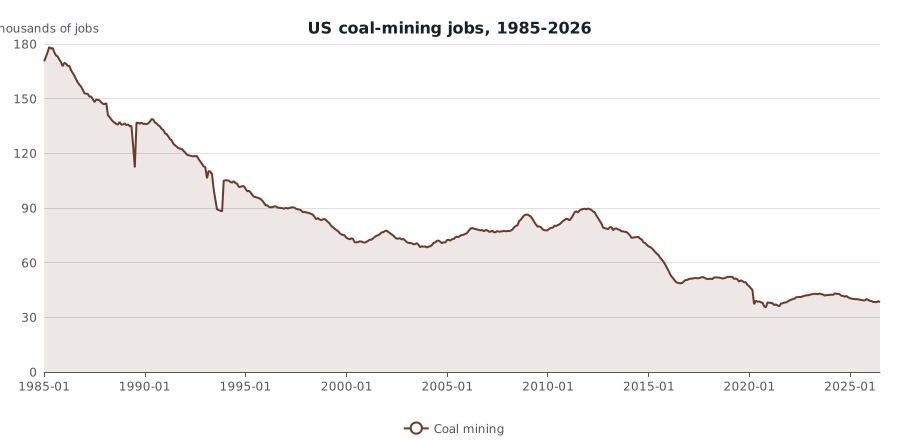
US coal-mining employment, thousands of jobs, seasonally adjusted, January 1985–July 2026. Bureau of Labor Statistics Current Employment Statistics, national. The series peaked at 178,300 in April 1985 in this window, briefly recovered to 89,700 in January 2012, and stood at 38,300 in July 2026. Payroll counts are not a measure of coal’s remaining electricity output.
Those are mining jobs, not power-plant jobs, and they are not a verdict on any one 2026 appropriation. They do show that “keeping coal alive” is not a matter of protecting a large, growing industry. The large industry is already gone.
What the fight is not about
Three distinctions matter more than the political slogans.
First, the fuel that replaced coal is gas, not wind. A coal revival that ignored 514 GW of gas capacity would be arguing with the wrong competitor.
Second, wind’s existing US footprint is onshore. Offshore wind in 2025 was 171 MW. Cancelling offshore projects is a fight over future coastal build-out, not over the 159 GW of turbines already running.
Third, capacity leadership is not output leadership. Solar passed coal on the grid in 2024 as a stock of installed megawatts. In 2023, the last year of generation data here, coal still produced more electricity than wind, and more than wind and solar PV combined. Anyone claiming that coal has already been overtaken as a source of kilowatt-hours is ahead of this evidence.
None of this measures 2026 electricity prices, the cost of cancelled projects, or whether the reported spending will raise household bills. IRENA’s 2025 capacity figures also cannot show whether 2026 policy has already changed the mix; they describe the system the policy is trying to steer. What they do show is the direction of travel. Coal is no longer the backbone. Gas is. Solar capacity has already passed coal. Wind is close. The mining workforce is a remnant. A revival large enough to restore coal’s old role would have to reverse all of that.
Sources and methods
This is retrospective research completed on 10 September 2026, using pinned IRENA and BLS dataset snapshots available then. It is not an as-of reconstruction of what was published on 10 July 2026.
Electricity figures are from IRENASTAT via the IRENA PxWeb API, snapshot dated 24 August 2026, covering annual capacity for 2000–2025 and annual generation for 2000–2023. Capacity series use IRENA’s United States (USA) geography; generation series use IRENA’s United States of America (the) label. Wind generation is the sum of IRENA’s onshore and offshore series; the offshore series begins in 2014. Total generation is IRENA total renewable plus total non-renewable electricity generation. Implied full-load hours divide 2023 generation by 2023 capacity; they are not a published capacity factor.
Employment figures are BLS Current Employment Statistics, coal mining, all employees, seasonally adjusted, national, from a 24 August 2026 CES snapshot, January 1985 through July 2026.
Reported administration spending comes from The Guardian, 10 July 2026, and is not independently audited here.
Research Date
The displayed date matches the related news edition. Research was completed 2026-09-10.
Related news: Daily · 2026-07-10
More Research
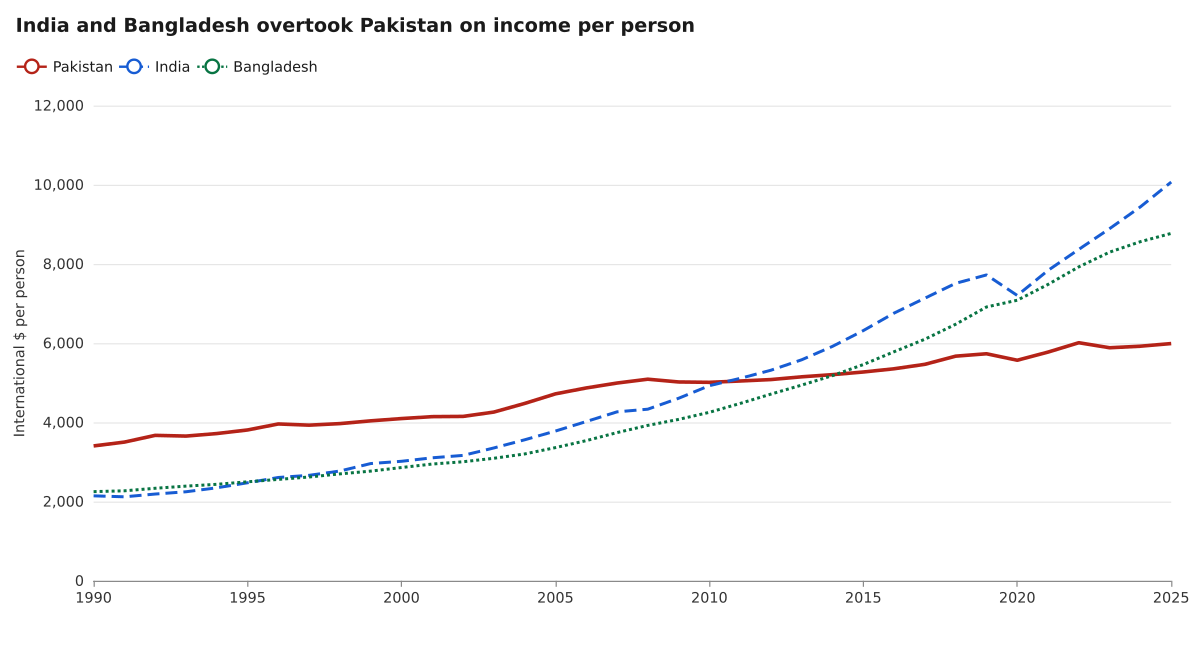
Pakistan Got Bigger. Its Neighbours Got Richer.
Pakistan added 105 million people after 2000 while India and Bangladesh overtook it on real income per person.
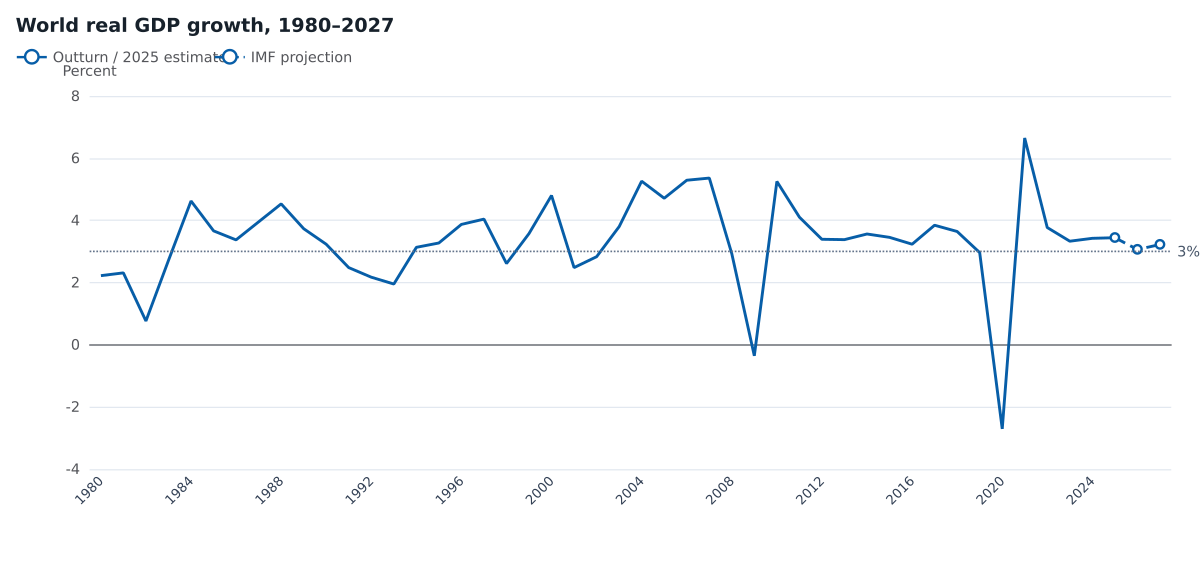
A 3 Percent World Is A Slowdown, Not A Slump
The IMF’s 2026 world-growth projection of 3.06 percent is a 0.39-point step down from 2025, near the long-run typical pace, with an $82 oil assumption below 2022.
Heat Can Take France’s Reactors Offline. Nuclear Is Still Most Of The Power System.
IRENA data through 2023 show nuclear still supplying 64% of French electricity, even though output is a quarter below its mid-2000s peak — so heat-driven reactor cuts hit the core of the gri