LunarWeave
Pakistan Got Bigger. Its Neighbours Got Richer.
On World Population Day 2026, Pakistan’s government put the army chief on a new National Population Council and called the country’s growth rate alarming. Dawn reported officials citing a 2.55 percent annual increase. Headcount is the wrong place to stop. The harder question is whether a much larger Pakistan has become a more prosperous one.
It has not, relative to the two countries that share its neighbourhood and once sat below it. In 2000, Pakistan’s constant-price GDP per person, measured at purchasing-power parity, was about $4,100. India’s was about $3,000 and Bangladesh’s about $2,900. By 2025 those neighbours had more than tripled that measure. Pakistan’s had risen 46 percent, to about $6,000. India first moved ahead in 2011. Bangladesh followed in 2015. The country that used to be richer per person is now poorer than both.
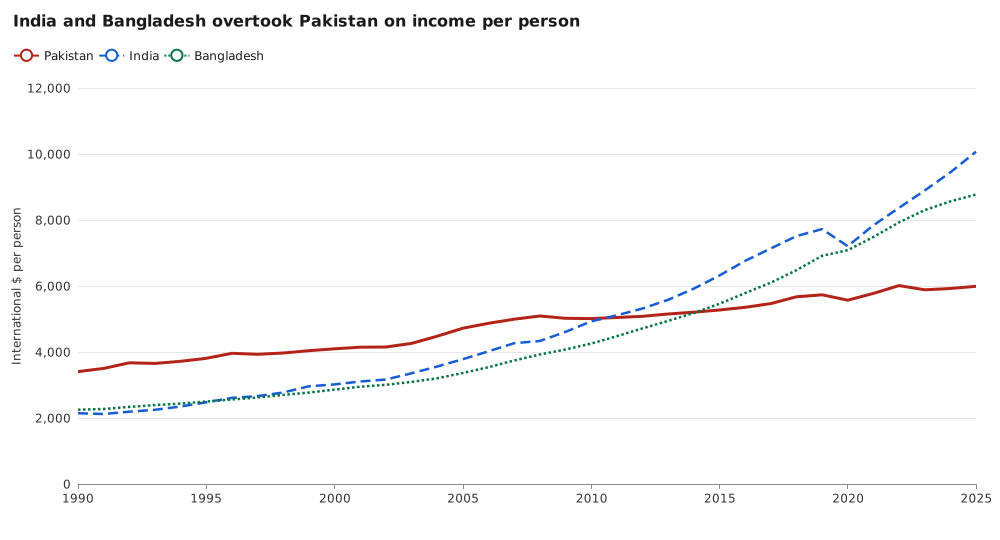
Constant-price GDP per capita at purchasing-power parity, international dollars per person, 1990–2025. India first exceeded Pakistan in 2011; Bangladesh did so in 2015. Source: IMF World Economic Outlook series NGDPRPPPPC. 2025 figures in this snapshot may still be estimates; later IMF projections are omitted. Readers choosing a country on the linked MacroVedia page should select Pakistan, India or Bangladesh.
A large country that is still adding people quickly
The IMF’s population series puts Pakistan at 135.6 million people in 2000 and 240.5 million in 2025 — 104.9 million more, a 77 percent increase, or 2.32 percent a year. That is not the same statistic as the 2.55 percent officials cited. The IMF series rises 1.9 percent in 2025. Census methods, reference years and revisions can differ; this article does not treat either figure as a correction of the other. What the IMF series does show is that Pakistan’s pace is high for a country of its size.
Among the ten most populous countries in 2025, only Nigeria added people faster over 2000–2025, at 2.61 percent a year. India grew 1.31 percent a year. Bangladesh, which had a similar population to Pakistan’s in 2000, grew 1.24 percent a year.
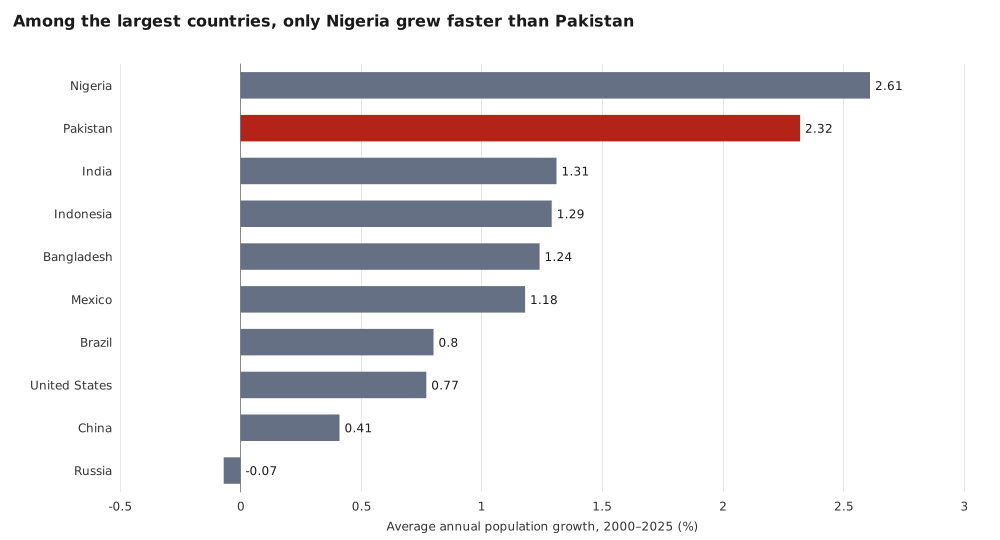
Average annual population growth, 2000–2025, for the ten most populous countries in 2025. Source: IMF World Economic Outlook population series LP. This is a headcount change, not a fertility rate.
A faster-growing population is not automatically a burden. It can be a larger workforce. It becomes a problem when output per person stalls — when the extra people are not matched by extra capital, skills and jobs.
The overtaking is not a rounding error
The constant-price PPP measure strips out inflation and exchange-rate swings so that a year’s output can be compared across countries. On that basis the reversal is large, not a photo finish.
| Constant-price PPP GDP per person | 2000 | 2025 | Change |
|---|---|---|---|
| Pakistan | $4,097 | $5,992 | +46% |
| India | $3,019 | $10,071 | +234% |
| Bangladesh | $2,859 | $8,774 | +207% |
India’s figure first exceeded Pakistan’s in 2011 ($5,112 against $5,047). Bangladesh’s did so in 2015 ($5,460 against $5,273). By 2025 India was about two-thirds higher than Pakistan, and Bangladesh about half again as high.
Current US dollars, a noisier yardstick, tell the same direction of travel. Pakistan’s dollar income per person was $733 in 2000, above India’s $443 and Bangladesh’s $483. In 2025 it was $1,696, below India’s $2,675 and Bangladesh’s $2,636. Dollar income is easily kicked around by the rupee: Pakistan’s figure fell from $1,651 in 2022 to $1,454 in 2023. That is why the PPP comparison is the one that matters for living standards. The dollar drop is still a reminder of how violent the 2023 crisis was.
Output barely outran the extra people
Pakistan’s real GDP contracted 0.2 percent in 2023. Average consumer-price inflation was 29.2 percent that year and 23.4 percent in 2024. Even in less chaotic years, growth has often been only a little faster than population. That arithmetic leaves little room for income per person to rise.
Investment is one reason the arithmetic is so tight. Total investment as a share of GDP in Pakistan never left a 13.2–18.3 percent band between 2000 and 2025. In 2025 it was 14.3 percent, against 33.9 percent in India and 28.5 percent in Bangladesh. A country that adds people rapidly while putting a small slice of output into buildings, machinery and inventories will tend to dilute capital per worker. That is a mechanism, not a full account. Energy shortages, political instability, weak tax capacity and repeated balance-of-payments crises all sit outside these series, and this comparison cannot rank them.
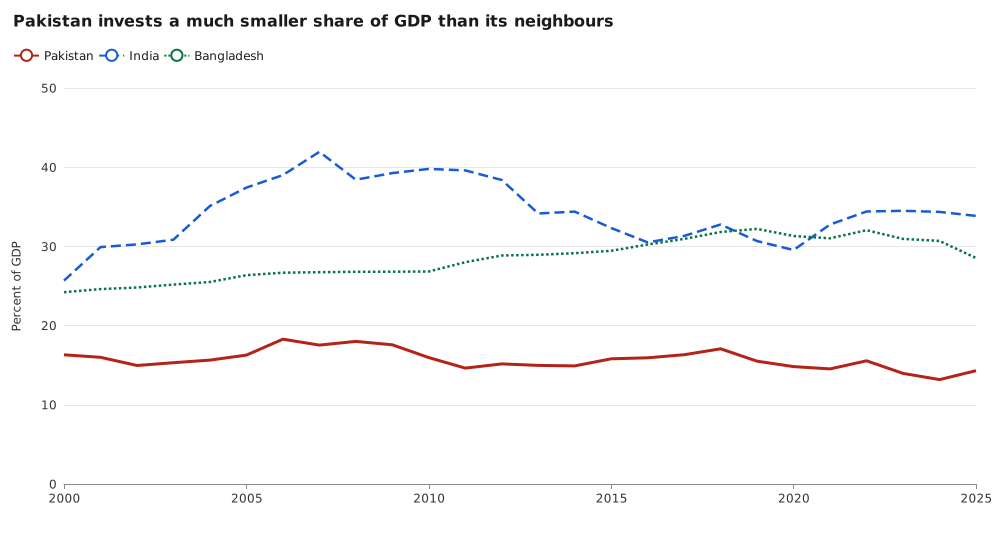
Total investment as a percent of GDP, 2000–2025. Source: IMF World Economic Outlook series NID_NGDP. The series does not say what was built, or how productively.
What the numbers do not decide
They do not show that fertility policy, or putting a general on a population council, will raise living standards. They do not show that India and Bangladesh grew because they had fewer births; both still added hundreds of millions of people. They show that Pakistan’s neighbours combined slower population growth with much faster growth in output per person, and that Pakistan did not.
If the political diagnosis is “too many people,” the economic record is narrower and blunter: too little extra output for the people Pakistan already has. A council that talks only about births will miss the part of the story that shows up in incomes.
Sources and methods
This is retrospective research, completed on 10 September 2026, on events reported on 11 July 2026. It uses the IMF World Economic Outlook as stored in a pinned snapshot ingested on 24 August 2026, not the vintages available that July. Figures through 2025 are the latest historical or estimated values in that snapshot; IMF projections for 2026–2031 are unused. 2025 observations can still be estimates.
Population is WEO series LP (persons). Living standards are series NGDPRPPPPC (GDP per capita at constant prices and purchasing-power parity, international dollars). Dollar incomes are NGDPDPC. Real GDP growth is NGDP_RPCH. Inflation is PCPIPCH (annual average consumer prices). Investment is NID_NGDP (total investment as a percent of GDP). Annualized population growth is compounded from the 2000 and 2025 levels, not an average of year-to-year rates. The ten-country ranking uses 2025 population to define “largest,” then 2000–2025 growth. Missing values are omitted, not treated as zero. The IMF is not Pakistan’s census authority; the 2.55 percent rate in July 2026 reporting is an attributed official figure, not an IMF observation.
Official source: IMF World Economic Outlook. Interactive series pages: GDP per capita, PPP, population, investment share (choose the country in each chart). Charts were rendered from the saved extracts; they were not separately tested in a browser layout.
Research Date
The displayed date matches the related news edition. Research was completed 2026-09-10.
Related news: Daily · 2026-07-11
More Research
Heat Can Take France’s Reactors Offline. Nuclear Is Still Most Of The Power System.
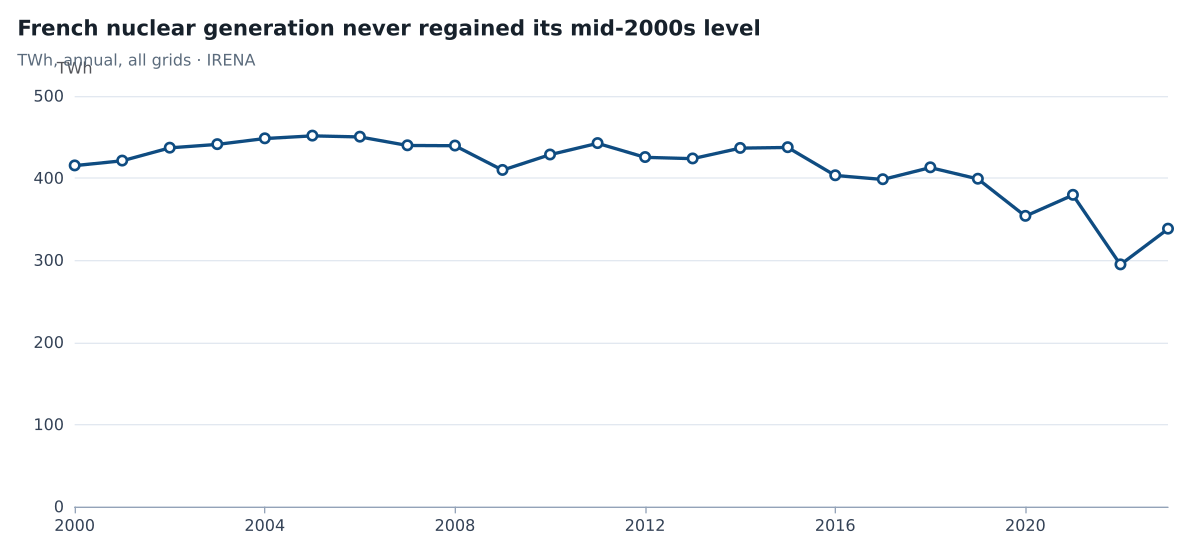
IRENA data through 2023 show nuclear still supplying 64% of French electricity, even though output is a quarter below its mid-2000s peak — so heat-driven reactor cuts hit the core of the gri
Solar Has Already Passed US Coal On The Grid
IRENA capacity shows US solar already larger than coal, with wind close behind; generation through 2023 still has coal ahead of wind and solar while gas is the largest source, and coal-minin
France Still Gets Most Of Its Electricity From Nuclear. The Plants Are Producing Less Of It.
France still generated 64 percent of its electricity from nuclear in 2023, a quarter below the 2005 peak, so river-temperature limits are a first-order grid risk.