LunarWeave
A 3 Percent World Is A Slowdown, Not A Slump
When the United States and Iran resumed striking each other in July 2026, oil markets did what they always do around the Strait of Hormuz: they jumped. Brent moved back toward $80 a barrel, ship traffic through the strait fell toward a standstill, and the International Monetary Fund put 2026 world growth at 3 percent, citing the war’s fallout. Three percent, delivered as a “cut,” sounds like the global economy is tipping over. In the Fund’s own numbers, it is a small step down from a pace the world has already been running.
What 3 percent actually is
In the IMF World Economic Outlook vintage used here, PPP-weighted world real GDP growth is 3.06 percent in 2026 (select the world aggregate in the chart). That is the Fund’s headline measure — the same family of numbers Al Jazeera reported as “3 percent” when the Fund cut the forecast. It is 0.39 percentage points slower than the 3.44 percent estimated for 2025, and 0.36 points slower than the 3.42 percent outturn for 2024.
It is not a crash. Across 45 historical years from 1980 through 2024, world growth averaged 3.35 percent and the median year was 3.42 percent. Fourteen of those years were slower than 2026’s 3.06 percent. The only contractions were 2009 (−0.36 percent) and 2020 (−2.71 percent). The 1991 Gulf War year grew 2.47 percent. Even 2008, when annual average oil ran at $96.8 a barrel, still grew 2.93 percent.
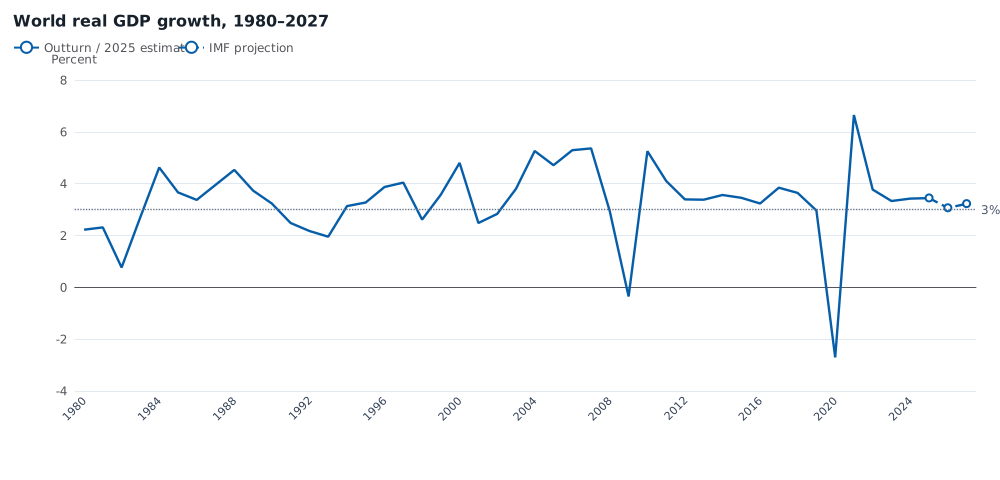
IMF World Economic Outlook real GDP percent change for the world aggregate (PPP-weighted). 1980–2024 are historical outturns in this vintage; 2025 is the Fund’s latest full-year estimate; 2026–2027 (dashed) are projections. The dotted line marks 3 percent. Source: IMF WEO, NGDP_RPCH, world. Snapshot created 24 August 2026.
The 3 percent figure is also a particular kind of world. Weighted by market exchange rates instead of PPP, 2026 growth is 2.56 percent, down from 2.86 percent in 2025. That lower number gives more influence to rich economies and is the better comparator for dollar-weighted global output. It is still a downshift of three-tenths of a point, not a recession print.
$80 oil is a return, not a new peak
The oil price that sits underneath the 2026 forecast is likewise less exotic than a $80 headline suggests. The WEO’s average petroleum spot price — a simple annual average of UK Brent, Dubai Fateh and West Texas Intermediate — is $82.2 a barrel in 2026, up $14.5, or 21 percent, from $67.7 in 2025.
That 2025 dip is doing a lot of work. The same series was already $80.6 in 2023 and $79.2 in 2024, years when the world grew 3.33 and 3.42 percent. Six historical years had a higher annual average than 2026’s $82.2: 2008, 2011–14 and 2022. The peak year is 2012, at $105.1. In 2022, the last large energy shock, oil averaged $96.4, up 39 percent from 2021 — and world growth was still 3.77 percent.
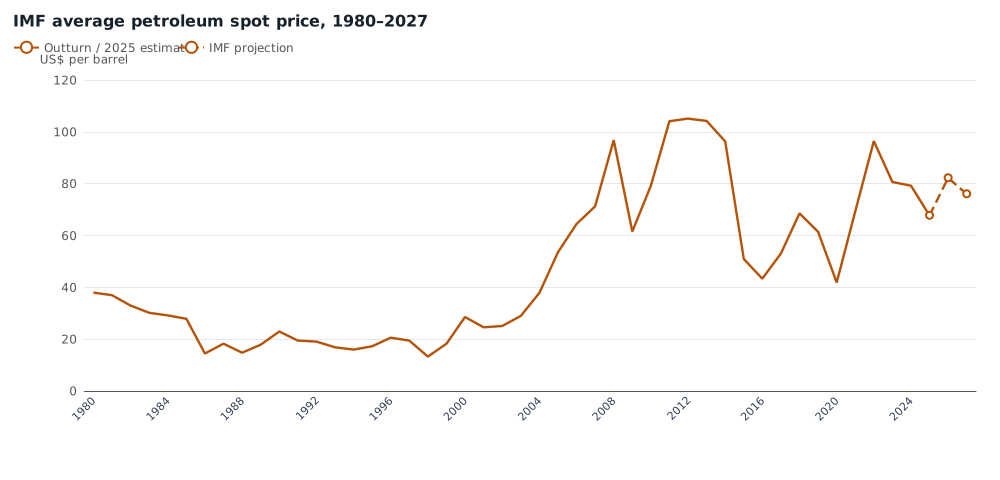
IMF WEO average petroleum spot price (POILAPSP), US dollars per barrel. 2026–2027 (dashed) are WEO oil-price assumptions, not daily quotes and not a futures curve. Source: IMF WEO. Snapshot created 24 August 2026.
A July spike toward $80 can still rattle gasoline and freight. It does not, on its own, put the world in 2012 or 2022 oil territory. The Fund’s 2026 assumption is a reversal of 2025’s cheaper barrel, back to the 2023–24 neighborhood.
| Year | Status in this vintage | World growth, PPP (%) | Oil, annual average ($/bbl) |
|---|---|---|---|
| 2009 | Outturn | −0.36 | 61.5 |
| 2011 | Outturn | 4.10 | 104.1 |
| 2020 | Outturn | −2.71 | 41.8 |
| 2022 | Outturn | 3.77 | 96.4 |
| 2023 | Outturn | 3.33 | 80.6 |
| 2024 | Outturn | 3.42 | 79.2 |
| 2025 | Estimate | 3.44 | 67.7 |
| 2026 | Projection | 3.06 | 82.2 |
Those pairings are not a causal model. 2009 and 2020 were financial and pandemic collapses, not oil stories; 2011 combined a Libya supply shock with a still-fast emerging world. The table’s use is narrower: years with $80–100 oil have not, in this history, been the years the global economy shrank.
The slowdown is smaller in the rich world than the headline implies
Inside the 3.06 percent world, advanced economies are projected at 1.78 percent in 2026, only 0.16 points below 2025’s 1.94 percent. They were already crawling. Emerging market and developing economies slow more, from 4.42 to 3.87 percent. The euro area, which contracted 6.0 percent in 2020, is at 1.09 percent in 2026 after 1.40 percent in 2025.
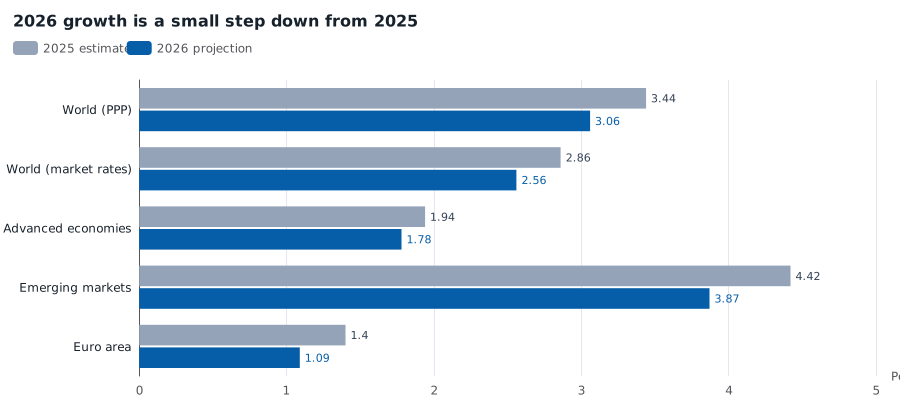
Real GDP percent change, 2025 IMF estimate versus 2026 projection. World PPP and market-exchange-rate measures are different aggregations of the same economies, not parts of one total. Source: IMF WEO. Snapshot created 24 August 2026.
Among large economies the 2026 vintage is not a uniform energy-shock map. The United States ticks up, from 2.12 percent in 2025 to 2.32 percent. Germany, already stagnant in 2023–24, is still only 0.79 percent. Japan slows from 1.19 to 0.72 percent, the United Kingdom from 1.32 to 0.80 percent. China goes from 4.96 to 4.41 percent; India from 7.62 to 6.48 percent — still fast, and still heavy in the PPP world total. Saudi Arabia slows from 4.50 to 3.11 percent. None of those country moves isolate the Iran war from the rest of the forecast.
Consumer-price inflation in this vintage does not replay 2022 either. World average CPI inflation is 4.42 percent in 2026, against 4.13 percent in 2025 and 8.67 percent in 2022. Advanced-economy inflation goes from 2.50 to 2.81 percent, versus 7.31 percent in 2022. A $14 rise in the annual oil average can still lift the price level. It is not, in these figures, another 2022 inflation spike.
What the 3 percent number cannot tell you
A world aggregate of 3 percent can hide a disaster in the country being bombed and a nuisance in a country that only pays a bit more for diesel. The WEO is an annual average, not a weekly shipping log. If the strait stayed closed, the 2026 oil assumption of $82.2 would be wrong, and so would the growth forecast that uses it. Daily prices near $80 in early July are not the same object as that annual average.
The 0.39-point downshift from 2025 to 2026 is the size of the Fund’s step, not a measured causal effect of Hormuz. The same vintage also embeds every other assumption the IMF chose — including the “AI demand partly offsets energy shock” line that accompanied the July cut. Correlation between high-oil years and slower growth is weak in this history once 2009 and 2020 are seen for what they were.
The useful reading of the 3 percent world is therefore unglamorous. After a week when oil headlines and a closed strait suggested a global rupture, the IMF’s own ledger still describes a world growing at about its usual pace, on an oil price it has already lived with, with the rich world’s weakness predating this war. That is less dramatic than a dead ceasefire. It is the part that was actually in the numbers.
Sources and methods. Figures are from the IMF World Economic Outlook, snapshot created 24 August 2026 (raw run 10 August 2026): real GDP percent change (NGDP_RPCH; market-rate counterpart NGDP_RPCHMK) and the average petroleum spot price (POILAPSP). World is WEO group 001; advanced economies group 110; emerging market and developing economies group 200; euro area group 163. 1980–2024 are treated as historical outturns in this vintage, 2025 as the Fund’s latest full-year estimate, and 2026 onward as projections. This article is retrospective: the news is from 9 July 2026; the research date is 10 September 2026. Later WEO figures were not known on 9 July. Charts were rendered to SVG; they have not been separately checked in a browser or on a phone.
Research Date
The displayed date matches the related news edition. Research was completed 2026-09-10.
Related news: Daily · 2026-07-09
More Research
Solar Has Already Passed US Coal On The Grid
IRENA capacity shows US solar already larger than coal, with wind close behind; generation through 2023 still has coal ahead of wind and solar while gas is the largest source, and coal-minin
The 3 Percent World Is Still Asia’s Expansion
The IMF’s 3 percent 2026 world-growth figure is a slower, Asia-weighted expansion under an $80 average Brent assumption — not a 2008-style oil-shock recession.
Pakistan Got Bigger. Its Neighbours Got Richer.
Pakistan added 105 million people after 2000 while India and Bangladesh overtook it on real income per person.