LunarWeave
The 3 Percent World Is Still Asia’s Expansion
When the ceasefire around the Strait of Hormuz broke in early July 2026, oil traders treated it as an energy shock and equity markets treated it as a growth scare. Brent crude jumped more than 5 percent and crested $80 a barrel. The same day, coverage of the International Monetary Fund’s update said the world economy would expand by a sluggish 3 percent in 2026, down from about 3.5 percent the year before.
Three percent sounds like a stall. In the Fund’s later World Economic Outlook vintage it is not a 2008- or 2020-style contraction. It is a slower expansion that still depends on Asia, priced off an $80 annual-average oil assumption rather than a year spent at wartime peaks.
Three percent is a weighting, not a temperature
The IMF’s headline world real GDP growth is purchasing-power-parity (PPP) weighted: large emerging economies count for more than they do in dollar terms. In the pinned WEO snapshot, that world aggregate is 3.06 percent in 2026, after 3.44 percent in 2025 and 3.42 percent in 2024. Rounded the way the Fund usually publishes, it is 3.1 percent — the “just 3 percent” of the July coverage.
Weight the same national growth rates by market exchange rates instead, and 2026 is 2.56 percent. That half-point gap is not a data error. It is the arithmetic of a world in which emerging and developing economies are projected at 3.87 percent and advanced economies at 1.78 percent. Emerging and developing Asia, about 35 percent of world PPP output in 2025, is still at 4.93 percent.
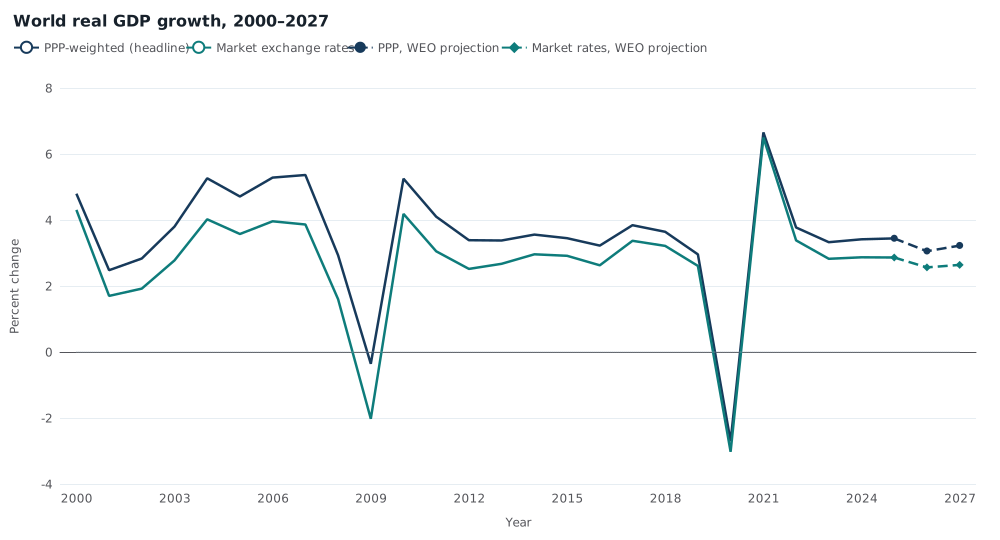
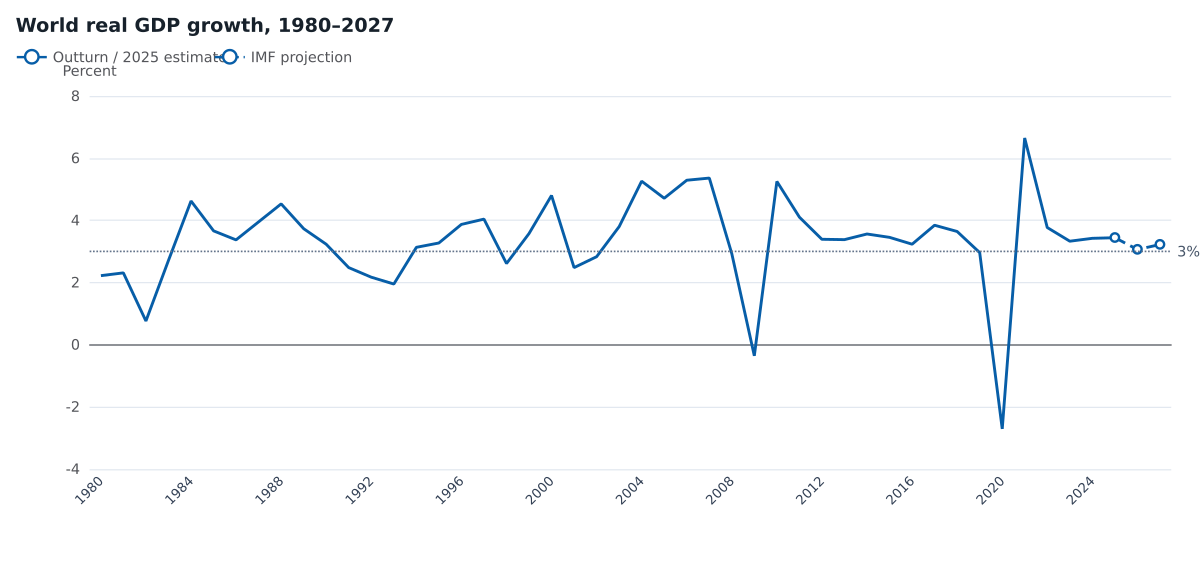
Annual percent change in real GDP. The IMF’s headline world figure is PPP-weighted; market-exchange-rate growth weights economies by dollar GDP. Solid lines are 2000–2025; dashed lines are WEO projections for 2026–2027 in an August 2026 snapshot. Source: IMF World Economic Outlook, NGDP_RPCH and NGDP_RPCHMK, world aggregate. Choose World on the linked series page; the live portal can differ from this snapshot.
Historically slow. Not a crash.
From 1980 through 2025, PPP-weighted world growth averaged 3.35 percent a year, or 3.68 percent in the 2010s. Against that recent bar, 3.06 percent is a downshift: 0.39 percentage points below 2025, and 0.62 points below the 2010s mean.
It is not a slump. Fourteen of those 46 years came in at or below the 2026 projection, clustering around familiar shocks — the early 1980s, the early 1990s, 1998, 2001–02, 2008–09, 2019–20. Only 2009 and 2020 were global contractions (−0.36 and −2.71 percent). The 2026 figure sits nearer 2008 (2.93 percent) and 2019 (2.96 percent) than those collapse years.
Eighty-dollar oil is not ninety-nine-dollar oil
July’s spot move and the IMF’s year-ahead oil assumption are easy to confuse. Reporting on 8 July described a one-day jump in Brent to around $78–$80 after tanker attacks and U.S. strikes. The WEO’s Brent series is an annual average, in dollars per barrel, not a futures quote. In this vintage that average is $80.19 in 2026, up $11.86 from $68.32 in 2025, and still $18.81 below 2022’s $99.00 — a dearer year than 2025, not a repeat of the post-invasion spike.
| Year | World PPP growth | Brent, annual average | World inflation | World trade volume | Status in this vintage |
|---|---|---|---|---|---|
| 2022 | 3.8% | $99 | 8.7% | 5.9% | historical |
| 2025 | 3.4% | $68 | 4.1% | 5.1% | historical/estimate |
| 2026 | 3.1% | $80 | 4.4% | 2.8% | projection |
| 2008 | 2.9% | $97 | 6.3% | 2.7% | historical |
| 2009 | −0.4% | $62 | 2.6% | −10.2% | historical |
Figures rounded to one decimal from the IMF WEO extract. Inflation is average consumer prices, percent change; trade is the volume of goods and services, percent change.
World average consumer-price inflation ticks up from 4.13 percent in 2025 to 4.42 percent in 2026 — three-tenths of a point, not a return to 2022’s 8.67 percent — then 3.66 percent in 2027. Trade takes the larger hit: volume growth slows from 5.10 percent in 2025 to 2.75 percent in 2026. That 2.35-point drop is several times the GDP slowdown. If Hormuz is in the forecast, it shows up more clearly in shipments than in the headline 3 percent.
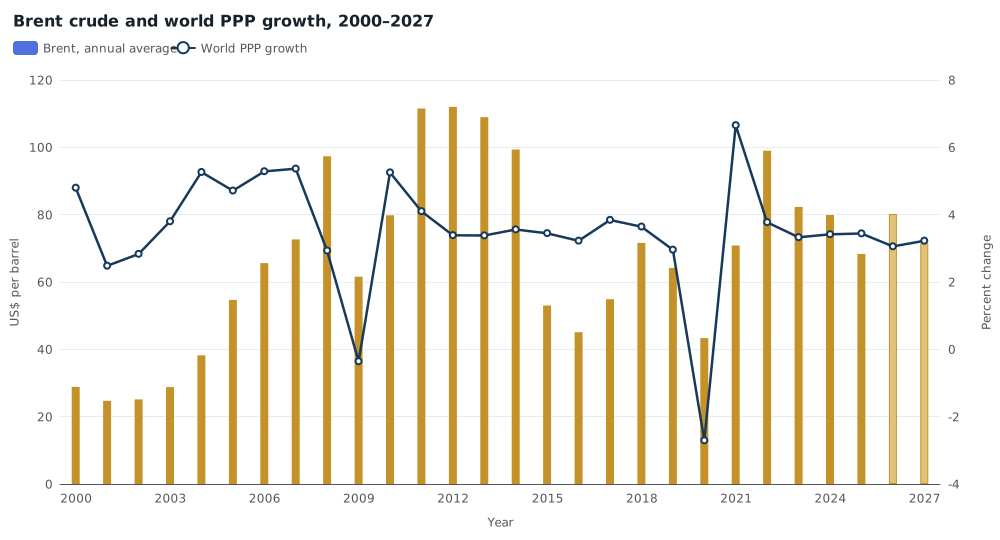
Bars: IMF annual-average Brent crude, U.S. dollars per barrel (left scale). Line: world real GDP growth, PPP-weighted, percent change (right scale). Paler bars from 2026 are WEO projections. The 2026 oil assumption is about $80, up from $68 in 2025, with world PPP growth still positive at 3.1 percent. Source: IMF WEO, POILBRE and NGDP_RPCH. Oil and growth moving together is not proof that oil caused the slowdown.
Who is carrying the 3 percent
The world figure is an average. Iran, at the centre of the July shock, is projected to contract 6.07 percent in 2026 after a 1.52 percent decline in 2025, then rebound 3.22 percent in 2027. China is at 4.41 percent, India 6.48 percent, the United States 2.32 percent.
A first-order contribution — each country’s 2025 share of world PPP output times its 2026 growth rate — puts China at about 0.87 percentage points of world growth and India at 0.53. Together that is 1.40 points, or roughly 46 percent of the 3.06 percent world total. The United States, on the same arithmetic, contributes about 0.34 points. This is not an official IMF decomposition, and the pieces do not add to the world total.
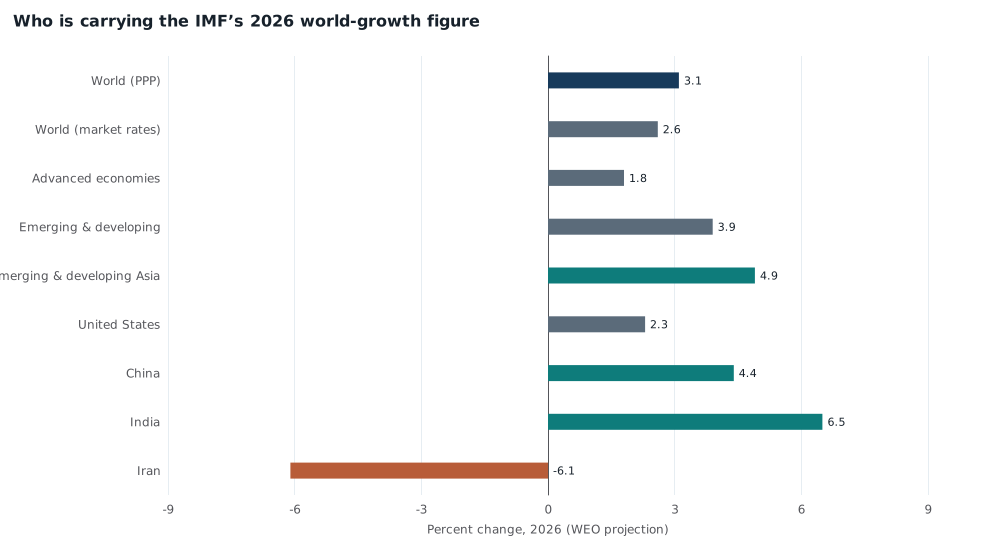
Projected 2026 real GDP growth, percent change, IMF WEO (August 2026 snapshot). World PPP is the headline 3.1 percent figure. Country bars are national growth rates, not contributions to the world total. 2026 values are projections. A lasting Hormuz disruption that pushed oil well above the $80 Brent assumption would change this vintage.
The slowdown from 2025 is more emerging-market than rich-world. Advanced economies ease from 1.94 to 1.78 percent. Emerging and developing economies slow from 4.42 to 3.87 percent; emerging and developing Asia from 5.54 to 4.93 percent. China and India both cool from 2025 (4.96 and 7.62 percent) while remaining far above the world average. The 3 percent world is not everyone stalled. It is Asia still expanding, the West crawling, and Iran shrinking.
A different oil path would be a different number. So would a different weighting: the same year is 2.6 percent if the world is counted in dollars. July coverage of an April-to-July downgrade cannot be checked in this later snapshot. Years from 2026 onward are projections, not outcomes. Markets priced a day on which Brent tagged $80. The Fund priced a year in which $80 is the average, Asia is still growing, and the world does not go backwards.
Sources and methods
This is retrospective research. The news date is 8 July 2026; the calculations use a pinned IMF WEO snapshot (raw run 10 August 2026, catalogue snapshot 24 August 2026), not an as-of-July reconstruction. Official series: IMF World Economic Outlook. World growth is NGDP_RPCH (PPP-weighted) and NGDP_RPCHMK (market rates); inflation is PCPIPCH (average consumer prices); trade is TRADEPCH (volume); oil is POILBRE (Brent, dollars per barrel); PPP shares are PPPSH. 2026–27 values in this vintage are projections. Group labels follow WEO aggregates (world, advanced economies, emerging and developing economies, emerging and developing Asia). Country contributions use 2025 PPP shares times 2026 growth and should not be read as an official decomposition. Charts were not separately tested in a browser; SVG rendering is not mobile QA.
Research Date
The displayed date matches the related news edition. Research was completed 2026-09-10.
Related news: Daily · 2026-07-08
More Research
A 3 Percent World Is A Slowdown, Not A Slump
The IMF’s 2026 world-growth projection of 3.06 percent is a 0.39-point step down from 2025, near the long-run typical pace, with an $82 oil assumption below 2022.
The AI Boom Is Not A US Chip-Factory Hiring Boom
US semiconductor manufacturing payrolls were 180,300 in June 2026, near the 2017 low, even as software and cloud jobs stayed well above 2019.
Solar Has Already Passed US Coal On The Grid
IRENA capacity shows US solar already larger than coal, with wind close behind; generation through 2023 still has coal ahead of wind and solar while gas is the largest source, and coal-minin