LunarWeave
Britain Is No Richer Per Person Than It Was In 2019
When Andy Burnham entered Downing Street in July 2026, he promised “breathing room” on the cost of living after a decade of political turnover. The inflation spike that defined 2022 and 2023 has receded. The deeper problem has not: on the IMF’s preferred international comparison, Britain’s real output per person in 2024 was still where it had been in 2019.
That is not a jobs collapse, and it is not mainly a story about prices still rising at 9 percent a year. It is a story about a recovery that restored the pre-pandemic level of output per person and then stopped.
A G7 recovery that skipped Britain
The IMF’s World Economic Outlook reports GDP per capita at constant purchasing-power parity (series NGDPRPPPPC). The measure asks a simple question: after adjusting for price differences across countries, how much real output is produced per resident? It is an average, not a typical household’s pay packet, and it is not a consumer-price index. It is the cleanest reading in this dataset of whether a country is getting richer per person.
From 2019 to 2024, that figure rose 0.08 percent in the United Kingdom — from about $55,400 to $55,400 in the IMF’s international dollars, a change too small to treat as growth. The same vintage shows a 9.0 percent rise in the United States, 7.4 percent in Italy, 2.8 percent in Japan and 2.1 percent in France. Canada, like Britain, was flat (0.1 percent). Germany was the only G7 economy to go backwards, at −1.5 percent.
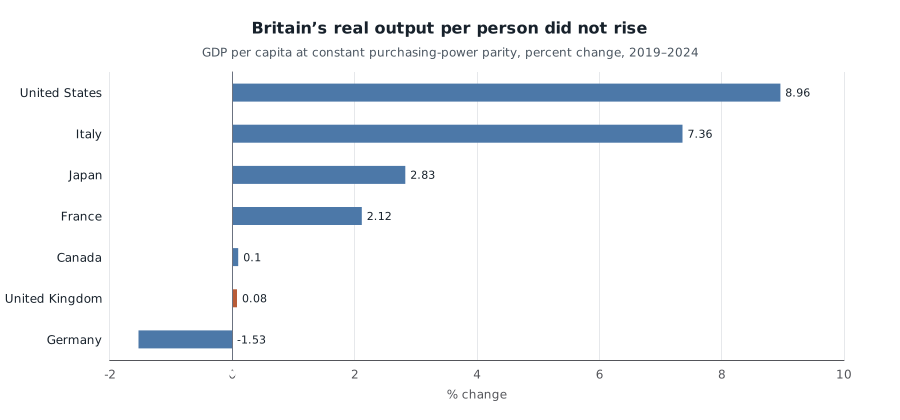
Percent change in GDP per capita at constant purchasing-power parity, 2019 to 2024, G7 members. Source: IMF World Economic Outlook, series NGDPRPPPPC. GDP per capita is average output, not median household income; 2025–26 IMF projections are excluded.
Italy’s bounce needs a caveat. It is a recovery from a depressed 2019 starting point: even after that gain, Italy’s real GDP per capita in 2024 was only 0.6 percent above 2007. Britain’s own long run is weak rather than catastrophic — up 6.7 percent from 2007 to 2024, against 23.7 percent in the United States — but the post-2019 period is when the gap with America opened in earnest. Britain’s real output per person was 80 percent of the US level in 2019 and 73 percent in 2024.
France, almost level with Britain in 2019, moved ahead.
The same stall appears in Britain’s own-currency series. Constant-price GDP per capita in pounds (series NGDPRPC) was 100.08 in 2024 if 2019 is set to 100. Purchasing-power parity is not manufacturing the result.
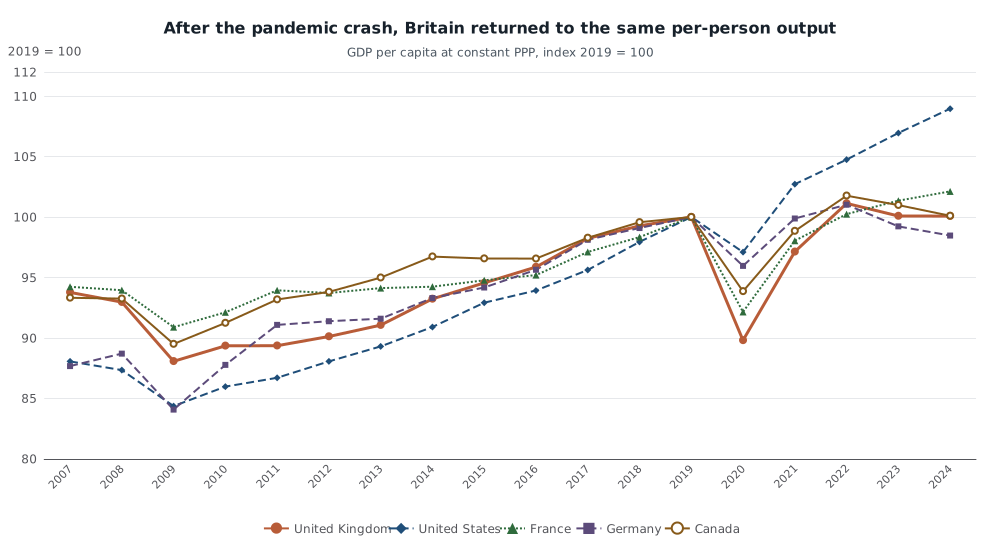
GDP per capita at constant purchasing-power parity, indexed to 2019 = 100, 2007–2024. Source: IMF World Economic Outlook, series NGDPRPPPPC. Britain’s 2024 index is 100.08.
Canada diluted a growing economy. Britain did not have one.
A flat per-person number can mean two different things. Either the economy grew and the population grew as fast, or the economy itself barely expanded.
Canada is the first case. Real GDP in 2024 was 9.6 percent above 2019, but the population rose 9.5 percent, to 41.1 million. Output per person went nowhere because more people shared a larger pie.
Britain is the second. Real GDP in 2024 was only 4.1 percent above 2019. The population rose 4.0 percent, from 66.6 million to 69.3 million. There was no larger pie to share. The 2020 collapse was brutal — real GDP fell 10.0 percent that year — and the rebound of 2021–22 restored the old per-person level without establishing a new one. Growth then faded to 0.3 percent in 2023 and 1.1 percent in 2024.
The United States grew in both dimensions, but unevenly: real GDP up 12.8 percent, population up 3.5 percent, hence the 9 percent rise per person. Germany’s total real GDP in 2024 was essentially the same as in 2019 (up 0.04 percent), so a 1.6 percent population increase was enough to push output per person down.
| Real GDP per capita, 2019–24 | Population, 2019–24 | Real GDP in 2024 vs 2019 | |
|---|---|---|---|
| United States | +9.0% | +3.5% | +12.8% |
| France | +2.1% | +2.1% | +4.2% |
| United Kingdom | +0.08% | +4.0% | +4.1% |
| Canada | +0.1% | +9.5% | +9.6% |
| Germany | −1.5% | +1.6% | +0.04% |
Sources: IMF WEO NGDPRPPPPC (per capita), LP (population, persons), NGDP_RPCH (real GDP growth compounded over 2020–2024). Rounding as in the charts.
Prices jumped. Then inflation cooled.
Average consumer-price inflation in Britain reached 9.1 percent in 2022 and 7.3 percent in 2023 before falling to 2.5 percent in 2024. That spike was worse than in the United States (8.0 percent then 4.1 percent) and far worse than in France.
Compounding the annual rates for 2020 through 2024, Britain’s 2024 average price level was about 24 percent above 2019. The United States and Germany were close behind, at 23 percent and 22 percent; France was 17 percent. The cost of living did rise. What did not happen is a matching rise in real output per person to pay for it.
By 2024 the rate of inflation was no longer extraordinary. The political argument about “breathing room” is now an argument about a higher price level sitting on top of unchanged real income per person.
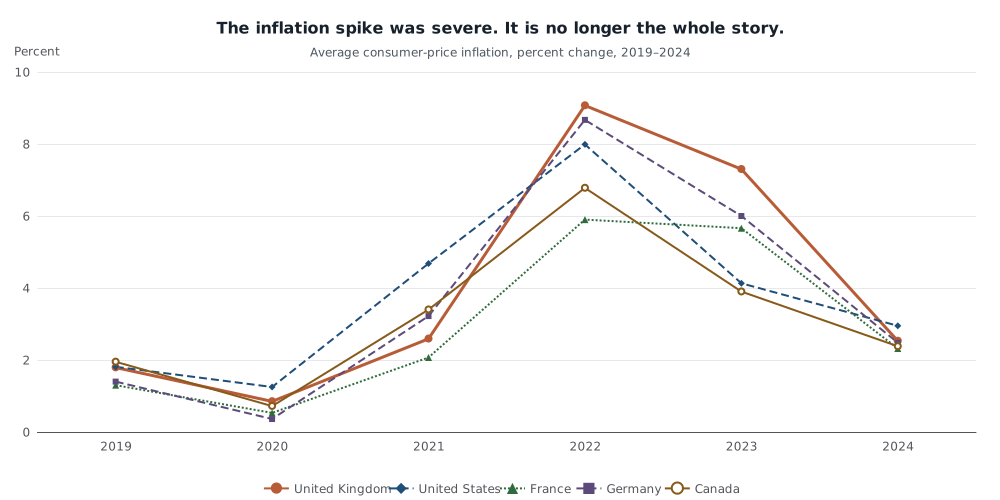
Annual average consumer-price inflation, 2019–2024. Source: IMF World Economic Outlook, series PCPIPCH.
Unemployment does not rescue the living-standards reading. The IMF puts Britain’s unemployment rate at 3.8 percent in 2022 and 4.3 percent in 2024 — still low. In this vintage the Fund projects 5.6 percent in 2026, a deterioration, not a 2010s-style jobs crisis. The missing ingredient is output per person, not an empty labour market.
What this does not show
These figures cannot say whether Burnham’s cost-of-living programme will work, and they do not measure housing costs, energy bills or the median wage. GDP per capita can rise while typical households feel poorer, and the reverse. Purchasing-power-parity comparisons also depend on the IMF’s price-level estimates.
The 2019–2024 comparison uses the historical estimates in an August 2026 snapshot of the WEO. Figures for 2025 and 2026 in the same file are IMF projections, not outcomes. Even those are modest: the 2026 projection leaves Britain’s real GDP per capita only 1.4 percent above 2019. If that path is right, “breathing room” will not arrive as a cyclical bounce. It would have to be built.
Methods and sources
This is a retrospective analysis. The news triggering the question is from 20 July 2026; the calculations use the IMF World Economic Outlook dataset in the pinned snapshot ingested on 10 August 2026 (research date 10 September 2026). Later releases were not available on digest day and are not treated as if they were. Official series documentation is in the IMF World Economic Outlook. Constant-PPP GDP per capita is NGDPRPPPPC; inflation is PCPIPCH (annual average consumer prices); real GDP growth is NGDP_RPCH; population is LP (stored here in persons). Years 2025–26 are projections in this vintage. Live MacroVedia pages for the same series matched the cited UK and US 2019 and 2024 values when checked; choose the country in the chart selector, as those pages do not accept a geography in the URL.
Research Date
The displayed date matches the related news edition. Research was completed 2026-09-10.
Related news: Daily · 2026-07-20
More Research
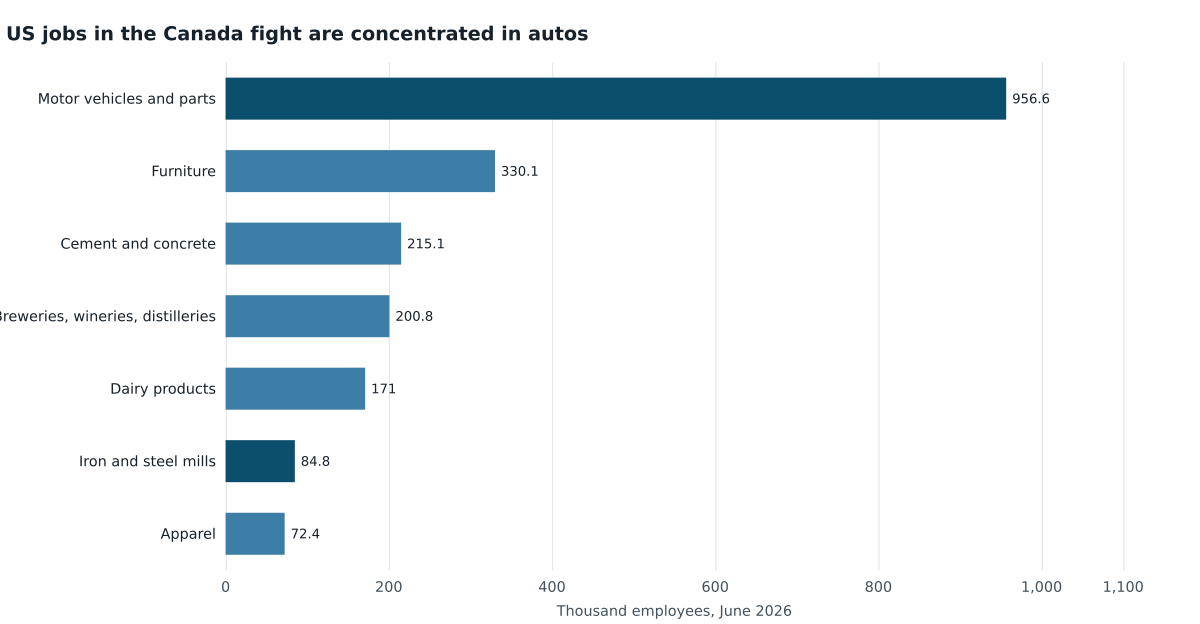
The New Canada Tariffs Are A Grab-Bag. The US Jobs Are In Cars.
A reported $20 billion US tariff list is 0.86 percent of Canada’s GDP but close to its current-account deficit. US payrolls in the fight sit in autos, not dairy.
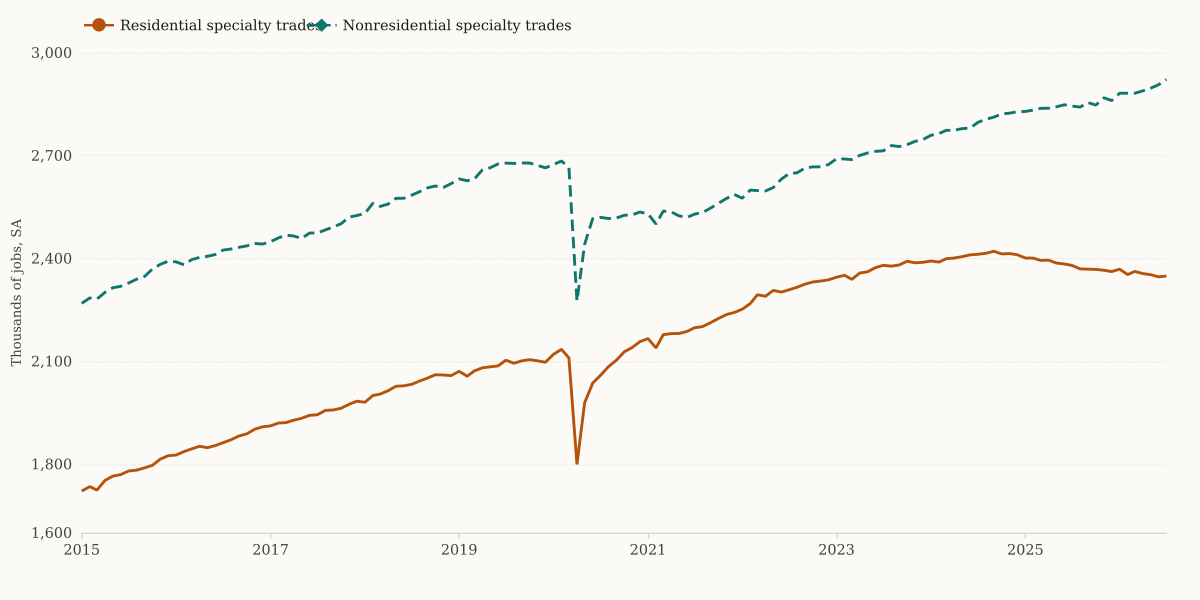
The Electrician Shortage Is A Tug-Of-War, Not An Empty Bench
U.S. electrician and HVAC contractor payrolls are at records. $40 an hour is no longer a premium; house work is losing people to better-paid nonresidential jobs.
The US Medicine Bill Grew. The Pill Factories Barely Did.
US pharmaceutical-products spending reached $669 billion in 2024, while finished-medicine factory payrolls remain near their early-2000s level.