LunarWeave
The Electrician Shortage Is A Tug-Of-War, Not An Empty Bench
When an AI campus goes up, it does not just need power and water. It needs people who can pull cable, set switchgear and keep the cooling plant from cooking the chips. Reporting in mid-July described that demand as a raid on ordinary life: data-center contractors bidding electricians and HVAC technicians away from house calls at about $40 an hour, with backlogs stretched and a shortfall of hundreds of thousands of workers on the horizon.
The payroll record does not show an emptied trade. It shows a workforce that has been growing for years, a $40 wage that is no longer special, and a split that does match the complaint from the residential side of the market. House-related contractors have been losing jobs. Nonresidential contractors have been gaining them. National statistics cannot prove that data centers caused that shift — factories, warehouses, hospitals and grid work hire the same crews — but they do show where the people went.
The bench got larger
In June 2026, firms classified as electrical contractors and other wiring installation contractors employed 1,152,100 people in the United States, seasonally adjusted. That is a record in the Current Employment Statistics history used here, 184,200 more jobs than in June 2019 — a 19 percent rise. Plumbing, heating and air-conditioning contractors employed 1,335,900, up 194,200 or 17 percent over the same seven years.
Together those two industries added 378,400 jobs while total private payrolls grew 5.7 percent and construction as a whole grew 10.9 percent. Over the year to June 2026 they were still hiring: electrical contractors added 37,300 jobs (3.3 percent) and HVAC contractors added 18,900 (1.4 percent). Average weekly hours at electrical contractors were 39.8, only a hair above 39.5 in June 2019. The national average is not a story of a shrinking crew working crushing overtime.
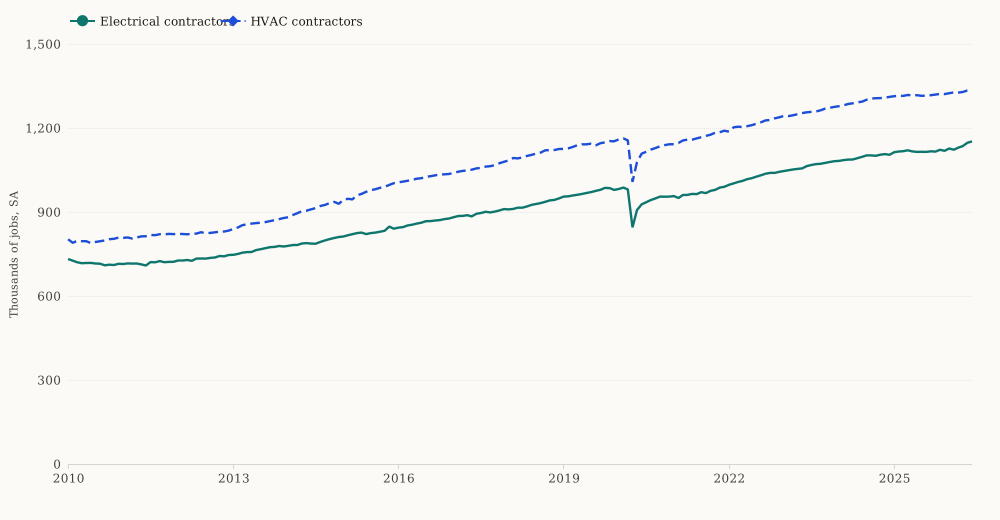
Seasonally adjusted payroll jobs at electrical contractors (NAICS 23821) and plumbing, heating and air-conditioning contractors (NAICS 23822), United States, January 2010–June 2026, thousands. June 2026 observations are preliminary. These counts are industry payrolls, not licensed-occupation headcounts. Source: U.S. Bureau of Labor Statistics, Current Employment Statistics.
These are employer payrolls, not a census of licensed electricians. An electrical-contractor firm includes estimators, supervisors and office staff as well as people on the tools, and the same firm may wire a house one month and a server hall the next. What the figures rule out is a simple disappearance of the industries that employ those trades.
$40 an hour is not a premium anymore
The $40 wage in that reporting is easy to check against the same survey. Average hourly earnings of all employees at electrical contractors were $43.54 in June 2026. HVAC contractors averaged $42.16. Electrical-contractor pay first reached $40 in March 2025 ($40.06). By last summer it was already ordinary for the industry, not a special data-center lure.
Pay did jump in the latest year. Electrical-contractor hourly earnings rose $3.09, or 7.6 percent, from June 2025 to June 2026. All private employees rose 3.4 percent, to $37.60. Construction as a whole rose 4.3 percent, to $41.36. The electrical-contractor premium over private pay widened from 11.2 percent to 15.8 percent in twelve months. In inflation-adjusted 1982–84 dollars, electrical-contractor hourly pay was almost unchanged from June 2019 ($12.50) to June 2025 ($12.58), then rose to $13.09 — a 4.1 percent real increase in a single year.
The more revealing gap is inside construction. Residential building-construction firms paid $39.74 an hour in June 2026. Nonresidential building-construction firms paid $47.25. That $7.51 gap is wider than the $4.53 gap in June 2019. If a $40 offer is pulling people off house jobs, it is because house work itself now pays about $40 — and commercial jobs pay more.
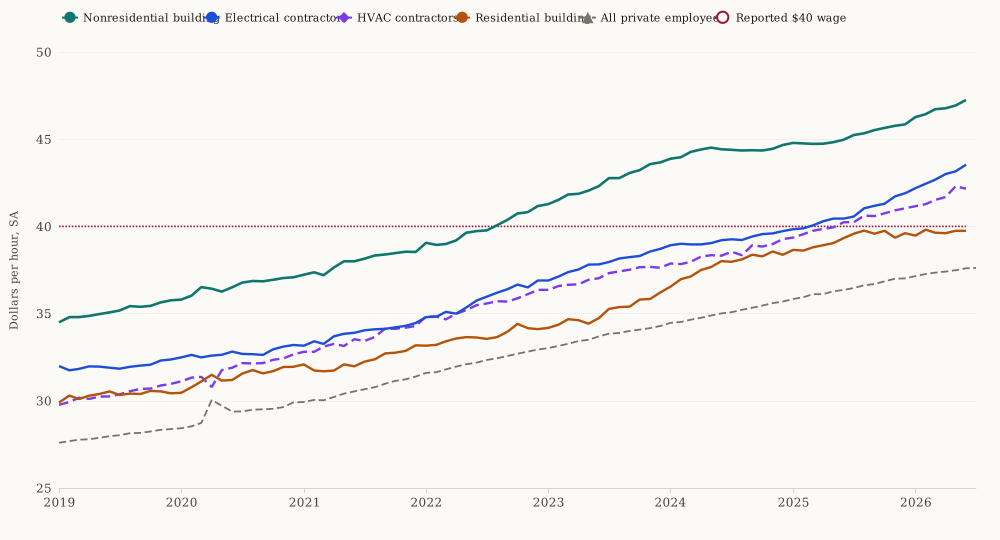
Seasonally adjusted average hourly earnings of all employees, current dollars, United States, January 2019–June 2026. The dotted line is the $40 figure used in July 2026 reporting. Averages mix tradespeople with office staff and do not measure overtime on a particular campus. Source: U.S. Bureau of Labor Statistics, Current Employment Statistics.
House work has been losing the bid
The employment split is sharper than the wage chart. Residential specialty trade contractors — the firms that do the wiring, piping, HVAC and finishing on houses — employed 2,346,400 people in June 2026, down 64,300 from June 2024 and 74,600 below a peak of 2,421,000 in September 2024. They are still larger than in June 2019 (2,086,700). The recent story is a retreat from a high, not a collapse to the last decade.
Nonresidential specialty trade contractors moved the other way: 2,906,800 jobs in June 2026, up 126,100 or 4.5 percent from June 2024 and 230,900 from June 2019. The two series add exactly to total specialty-trade employment. Over two years the residential side shed jobs while the nonresidential side added about twice as many.
Residential building construction itself fell 22,200 jobs from June 2024 to June 2026, to 915,100. Nonresidential building construction rose 34,300, to 949,100.
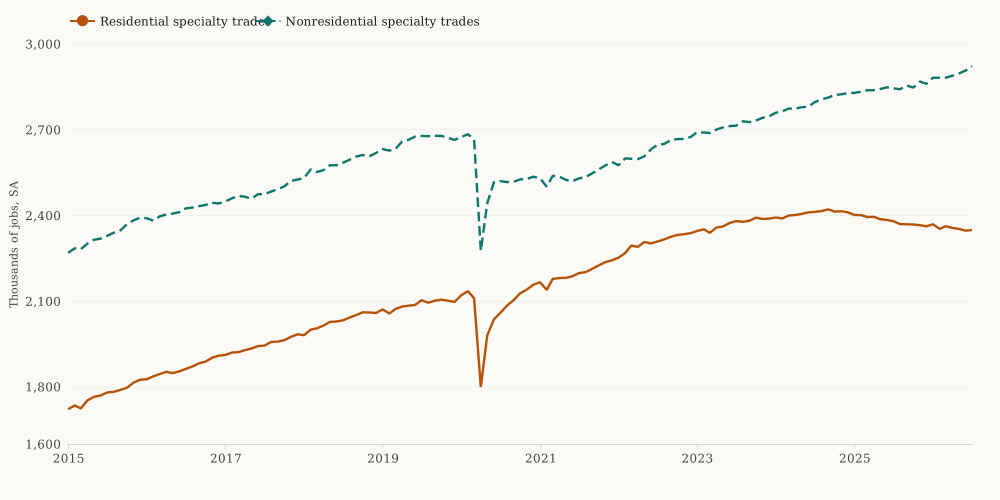
Seasonally adjusted payroll jobs at residential and nonresidential specialty trade contractors, United States, January 2015–June 2026, thousands. The split does not isolate data-center projects. Source: U.S. Bureau of Labor Statistics, Current Employment Statistics.
That pattern is what a bidding war looks like in a survey that cannot see project type. It is also what a housing slowdown looks like. Higher mortgage rates, fewer starts and a pause in remodeling would cut residential payrolls even if no hyperscale campus had been poured. The data cannot separate those forces. They can say the people did not leave construction. They changed which side of it they work on.
| Industry (seasonally adjusted) | Jobs, June 2026 (thousands) | Change since June 2019 | Average hourly earnings, June 2026 |
|---|---|---|---|
| Electrical contractors | 1,152.1 | +19.0% | $43.54 |
| HVAC contractors | 1,335.9 | +17.0% | $42.16 |
| Residential specialty trades | 2,346.4 | +12.4% | — |
| Nonresidential specialty trades | 2,906.8 | +8.6% | — |
| Residential building construction | 915.1 | +12.0% | $39.74 |
| Nonresidential building construction | 949.1 | +13.1% | $47.25 |
| All private employees | — | +5.7% | $37.60 |
June 2026 figures are preliminary. Earnings are for all employees, not a production-worker subset. Source: BLS CES.
What the payrolls cannot see
Industrial building construction — a classification that might capture some large technical buildings — employed only 165,900 in June 2026, just 5,700 above June 2019. Power and communication line construction, closer to the grid connections campuses need, employed 250,400, up 37,500 or 18 percent since June 2019. Neither series is a data-center headcount. If the boom is large, it is showing up as demand for electricians and pipefitters, not as a new mass employer in one narrow building code.
The survey also cannot confirm the other numbers in the shortage story. Contractor backlogs, a projected 500,000-worker gap and local $40 offers in Texas or Arizona are not CES concepts. A national average of $43.54 can coexist with much higher prevailing wages on a union job, and with homeowners who still cannot get a callback. Tightness is about unmet demand, not only about falling employment.
The practical conclusion is narrower, and more useful. America did not misplace its electrician and HVAC contractors. Those payrolls are at records. What changed is the price of keeping them on houses. Residential building pay is the $40 wage. Nonresidential building pay is $47. Until that gap narrows, home repairs will keep losing the auction — whether the winning bid is a data hall, a factory or a hospital wing.
Sources and methods
Employment, hours and earnings are from the U.S. Bureau of Labor Statistics Current Employment Statistics national estimates, seasonally adjusted, retrieved from the official CES bulk files. Detailed industry series run through June 2026 and are marked preliminary. Levels are thousands of payroll jobs, not occupations and not full-time-equivalent counts. Average hourly earnings are for all employees in current dollars except where 1982–84 dollars are stated. Combined electrical- and HVAC-contractor employment adds two non-overlapping NAICS industries; residential and nonresidential specialty trades add to the specialty-trade total.
This is retrospective research written on 10 September 2026 about reporting from 19 July 2026. Figures come from a CES snapshot dated 24 August 2026, which can include later revisions than were available in July. Observation months are not release dates.
Research Date
The displayed date matches the related news edition. Research was completed 2026-09-10.
Related news: Daily · 2026-07-19
More Research
Britain Is No Richer Per Person Than It Was In 2019
IMF data show UK real GDP per capita was unchanged from 2019 to 2024, unlike the United States, while consumer prices were about a quarter higher.
Pakistan Is Resetting Fuel Prices After Already Closing Its Current-Account Gap
IMF current-account figures show Pakistan had already closed its 2022 external gap when it moved to daily fuel-price resets; Egypt had not.
The New Canada Tariffs Are A Grab-Bag. The US Jobs Are In Cars.
A reported $20 billion US tariff list is 0.86 percent of Canada’s GDP but close to its current-account deficit. US payrolls in the fight sit in autos, not dairy.