LunarWeave
The New Canada Tariffs Are A Grab-Bag. The US Jobs Are In Cars.
President Donald Trump’s 50 percent duties on a list of Canadian goods — wine, hockey sticks, cement, dairy, furniture, clothing, wigs — were sold as punishment for a neighbour that, he said, needs the United States to survive. Canadian provinces, for their part, have been refusing to restock American alcohol until older tariffs on cars and steel come off.
Those are not the same fight. US payroll records show where American jobs actually sit. In June 2026, motor vehicles and parts employed 956,600 people. Dairy product manufacturing employed 171,000, near a record high. Iron and steel mills employed 84,800. Apparel manufacturing employed 72,400.
A reported $20 billion tariff list is small beside Canada’s $2.32 trillion economy. It is not small beside a current account that was already $21.7 billion in deficit in 2025. Choose Canada in those charts; they do not open on Canada by default.
A $20 billion list on a $2.3 trillion economy
Dawn reported that the US Trade Representative said the new 50 percent duties, invoked under Section 338 of the 1930 Tariff Act, would apply to nearly $20 billion of imports from Canada — about 5.2 percent of $382 billion of US goods imports from Canada in 2025, citing Census Bureau data. Those Census totals are not in the datasets used here. They remain a news figure. The Guardian quoted Trump claiming Canada cannot survive without the United States, and said the two governments would talk before the duties took effect.
What can be measured is scale against Canada’s accounts. In the IMF World Economic Outlook, Canada’s 2025 GDP was $2.32 trillion at current prices. Twenty billion dollars is 0.86 percent of that. Canada is not a rounding error next to the United States, but it is much smaller: its dollar GDP was about 7.5 percent of US GDP in 2025.
The same $20 billion is, however, about nine-tenths the size of Canada’s 2025 current-account deficit of $21.7 billion (0.9 percent of GDP). Canada has run a current-account deficit in every year since 2022 in this IMF vintage. That does not mean the tariffs would widen the deficit by $20 billion. Import value is not Canadian GDP, exporters can divert shipments, and US buyers can absorb part of the duty. It does mean Canada is not entering a trade shock from a position of external surplus.
The labour market was already softer. IMF unemployment rose from 5.4 percent in 2023 to 6.9 percent in 2025. Real GDP grew 1.7 percent in 2025, and the volume of goods exports fell 2.0 percent.
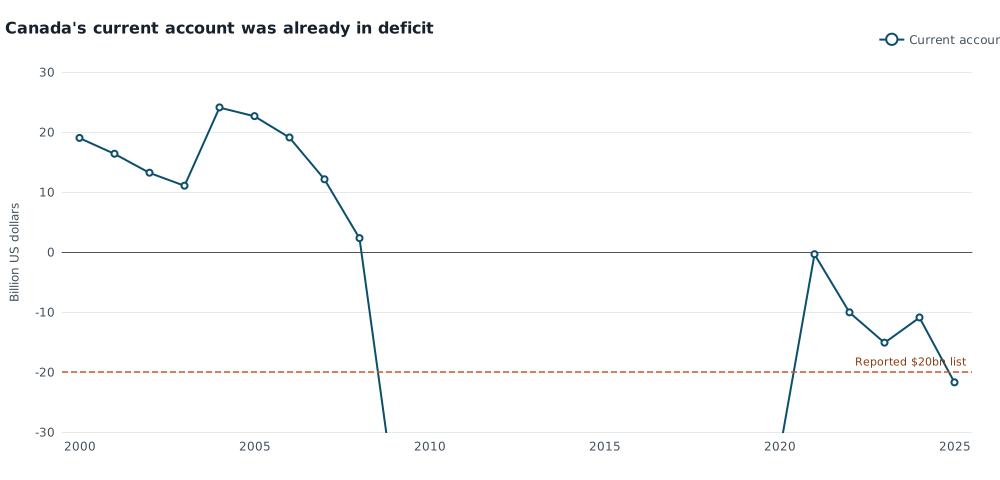
Canada's current-account balance in billions of current US dollars, annual, 2000–2025. The dashed line at −$20 billion marks the news-reported size of the new US tariff list, not an IMF series and not a forecast of how much the current account would change. 2025 is an IMF estimate in the 24 August 2026 World Economic Outlook snapshot. Source: IMF World Economic Outlook, current account balance (US$).
The jobs are not in dairy
The political story of tariffs is jobs. The industries named in the new list, and the auto and steel fight that provinces have been retaliating over, do not employ similar numbers of Americans.
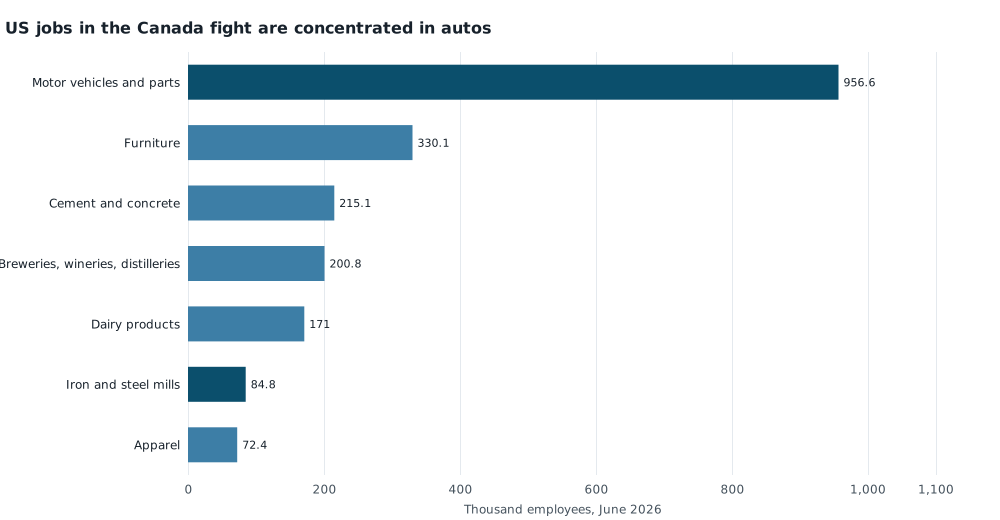
Seasonally adjusted US payroll employment, thousands of employees, June 2026 (preliminary). Motor vehicles and parts and iron and steel mills are the industries in the older car-and-steel tariff fight; the other bars are counterpart industries named in the new Section 338 list (wine is only part of breweries, wineries and distilleries; cement and concrete includes ready-mix, not only cement plants). These are US industry totals, not workers making goods that compete with the listed Canadian imports. Source: U.S. Bureau of Labor Statistics, Current Employment Statistics.
| Industry (US, June 2026) | Employees (thousands, SA) | Share of manufacturing |
|---|---|---|
| Motor vehicles and parts | 956.6 | 7.6% |
| Furniture and related products | 330.1 | 2.6% |
| Cement and concrete products | 215.1 | 1.7% |
| Breweries, wineries, distilleries | 200.8 | 1.6% |
| Dairy product manufacturing | 171.0 | 1.4% |
| Iron and steel mills | 84.8 | 0.7% |
| Apparel manufacturing | 72.4 | 0.6% |
| All manufacturing | 12,606 | 100% |
Motor vehicles and parts account for 7.6 percent of US manufacturing employment and 0.6 percent of the 158.9 million nonfarm jobs. Dairy plants are 1.4 percent of manufacturing. Steel mills are 0.7 percent. Auto plants employ 5.6 times as many people as dairy plants and 11 times as many as steel mills.
Those totals are not a count of jobs that “compete with Canada.” Cement and concrete product manufacturing includes ready-mix plants pouring American sidewalks. Breweries, wineries and distilleries is a wider alcohol industry than wine. Furniture employment is the whole domestic industry, already down from a peak of 683,100 in July 2000. Apparel employment is 92 percent below January 1990.
Dairy is the opposite of a collapsing industry. Payrolls were 171,000 in June 2026, against 155,900 in December 2019, and the series high in this extract is 171,300 in May 2026. Protecting dairy jobs from Canadian imports is a hard story to tell from a headcount at a record.
Steel mill employment, the totem of an earlier tariff era, is 55 percent below January 1990 and has been roughly stable near 85,000 for several years. If mill towns are the political prize, they are a small payroll.
The industry with the jobs — autos — is also the one most tightly bound to Canada through the US-Mexico-Canada agreement. Tariffs on a cross-border production line can destroy the same jobs they are advertised to protect. The BLS series cannot say which way that will go. It can say the stakes are not in wigs or hockey sticks.
Motor-vehicle and parts employment has already eased, from 1,021,400 in July 2024 to 964,500 in July 2026, a drop of 56,900, or 5.6 percent. That decline predates the Section 338 list and has many possible causes, including earlier auto and steel duties, the 2020 collapse and rebound, and shifts inside the industry. It is context, not a tariff impact estimate.
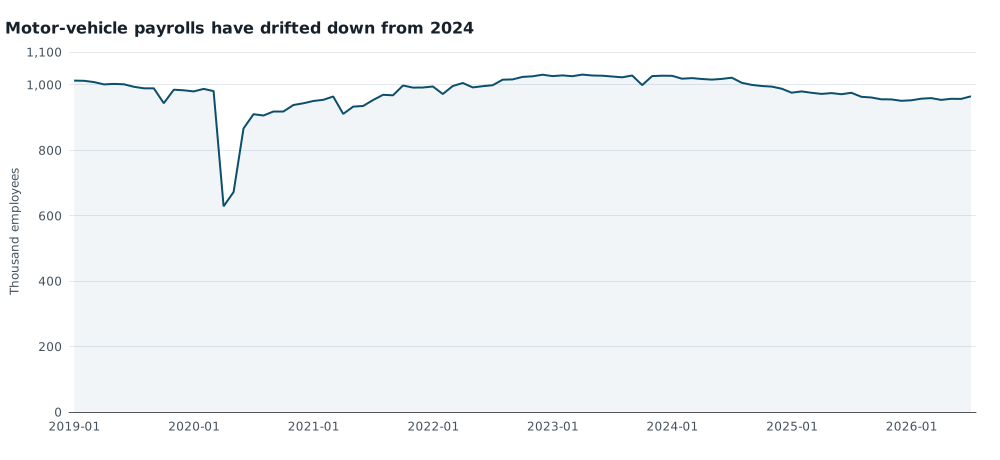
US seasonally adjusted payroll employment in motor vehicles and parts, thousands of employees, monthly from January 2019 to July 2026. July 2026 is preliminary. The 2020 collapse and rebound dominate the scale. Source: BLS CES series CES3133600101.
What the figures cannot decide
Indexed trade data that would show how much of each US industry’s output competes with Canadian goods are not part of this analysis. The $20 billion figure, the product list, and the Census comparison come from reporting, not from the IMF or BLS extracts. Employment is a headcount, not value added, and not a measure of who pays a tariff. IMF figures for 2026 in the same snapshot are projections and are not used here as outcomes.
If the test of this fight is whether Canada “needs” the United States to survive, a list worth 0.86 percent of Canadian GDP does not settle that. If the test is whether Washington is defending shrinking American factory towns, dairy payrolls at a record and apparel payrolls that have already vanished are poor exhibits. The jobs that would actually move the manufacturing needle sit in motor vehicles — an industry that already employs more than five times as many people as dairy plants, and that runs through the same border the new tariffs are meant to police.
Sources and methods
This is retrospective research, written on 10 September 2026 about events reported on 21 July 2026. It uses later pinned snapshots, not the information set available that July day.
Canada’s GDP (current US dollars), current-account balance, unemployment, real GDP growth and goods-export volume are annual IMF World Economic Outlook series from a snapshot dated 24 August 2026. Values for 2025 are IMF estimates in that vintage. US payrolls are seasonally adjusted monthly Current Employment Statistics from a Bureau of Labor Statistics snapshot dated 24 August 2026; June 2026 detailed industry figures, and July 2026 figures where used, carry BLS’s preliminary footnote. Industry series are US national totals, not import-competing subsets, and cement-and-concrete, beverage, and furniture groups are broader than the named tariff items.
Research Date
The displayed date matches the related news edition. Research was completed 2026-09-10.
Related news: Daily · 2026-07-21
More Research
The US Medicine Bill Grew. The Pill Factories Barely Did.
US pharmaceutical-products spending reached $669 billion in 2024, while finished-medicine factory payrolls remain near their early-2000s level.
Britain Is No Richer Per Person Than It Was In 2019
IMF data show UK real GDP per capita was unchanged from 2019 to 2024, unlike the United States, while consumer prices were about a quarter higher.
Saudi Arabia Still Generates Two-Fifths Of Its Electricity From Oil
In 2023 Saudi Arabia still generated 39 percent of its electricity from oil. The UAE already runs nuclear plants and has no oil residual on the grid.