LunarWeave
The US Medicine Bill Grew. The Pill Factories Barely Did.
A 100% tariff on imported generic drugs, announced in July 2026 and scheduled for August 2028, is being sold as industrial policy: France 24 reported that the duty is meant to bolster US pharmaceutical production. Indian manufacturer Dr Reddy’s, in turn, warned that American patients would pay more because shifting production is not practical.
Those are claims about factories and import dependence. The official data that can be checked on a consistent national basis do not split generics from brand-name drugs, and they do not split imported pills from domestic ones. They do show something more basic, and more stubborn. Americans now devote a much larger dollar bill — and a larger share of household spending — to pharmaceutical products than they did a generation ago. The US payroll in pharmaceutical preparation manufacturing, the factory industry that makes finished medicines, is only a few thousand people larger than it was in 2003.
A bigger line in the household budget
In 2024, US personal consumption of pharmaceutical products was $669.0 billion, according to the Bureau of Economic Analysis’s current-dollar PCE-by-function accounts. That was 3.36% of all personal consumption expenditures, up from $102.3 billion and 1.85% in 1997.
The share rose quickly through the 2000s, then stopped climbing. By 2010 it was already 3.14%. From 2011 through 2024 it mostly stayed between about 3.2% and 3.4%, aside from a 2020 spike when total consumer spending fell and the medicine bill did not. The dollar total kept growing anyway, because the whole consumption basket grew. Pharmaceutical products were 6.5 times their 1997 current-dollar level in 2024; total PCE was 3.6 times as large.
Medicines also took more of the health budget. Pharmaceutical products were 16.4% of household health consumption in 2024, compared with 11.1% in 1997.
These figures are not a count of prescriptions. They are current dollars, so they mix higher prices, a shift toward costlier specialty drugs, and any increase in use. They include medicines paid for by insurers as well as out of pocket. They are still the right denominator for a policy that will land on the price of pills: this is a large, mature slice of what US households consume.
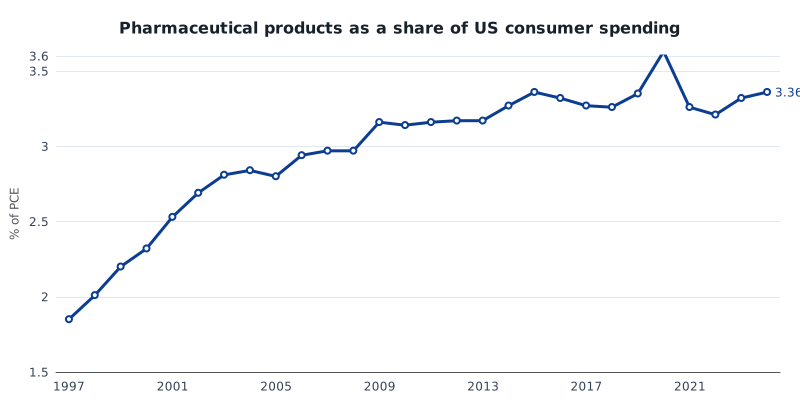
US household consumption of pharmaceutical products as a percent of total personal consumption expenditures, 1997–2024. Values are current dollars (not inflation-adjusted), so the rise mixes higher prices, a shift toward costlier medicines, and more use. The series covers all pharmaceutical products, not imported generics alone. Source: U.S. Bureau of Economic Analysis, PCE by state by function (SAPCE4), United States.
The finished-medicine payroll did not scale with that bill
The closest CES factory series to “making finished medicines” is pharmaceutical preparation manufacturing (NAICS 325412). On an annual average of seasonally adjusted monthly payrolls, that industry employed 186,000 people in 1997 and 228,000 in 2003. It then lost jobs for a decade, bottoming at 202,000 in 2016, and recovered to 232,000 in 2024 and 234,000 in 2025. June 2026, the latest month in this snapshot, was 235,400.
That is a 25% increase from 1997 to 2024, and still only about 2% above the 2003 level by 2025. Over the same 1997–2024 window, the medicine bill in current dollars rose 554%. Indexed to 1997, spending in 2024 stood at 654; preparation-manufacturing jobs stood at 125.
The broader factory industry, pharmaceutical and medicine manufacturing (NAICS 3254), did better. It includes biological products and in-vitro diagnostics as well as preparation plants. Its annual-average payroll rose from 236,000 in 1997 to 351,000 in 2024, a 49% increase, and to 355,000 in 2025. Even that faster factory series is a rounding error in the job market: 0.22% of US nonfarm employment in 2024. Pharmaceutical products were 3.36% of consumer spending that year.
Those two percentages are not the same kind of thing, and they do not prove that the missing medicines were imported. They do show the mismatch a production-rebuild tariff is walking into. The consumption category is large. The domestic factory payroll, especially in finished-dose plants, is not.
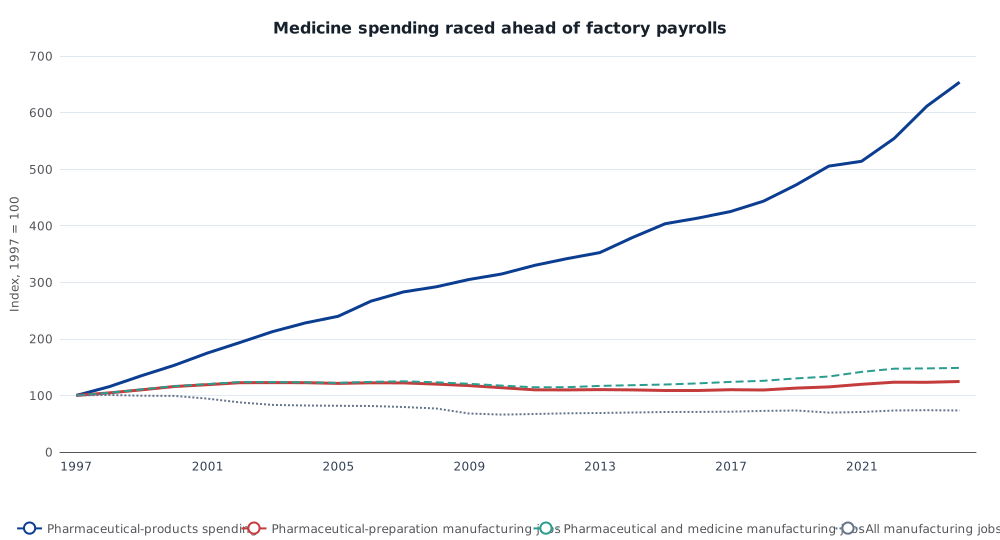
Index, 1997 = 100. Pharmaceutical-products spending is BEA current-dollar PCE. Jobs are annual averages of BLS seasonally adjusted monthly payrolls. Current-dollar spending is not the same as the volume of pills produced, and payrolls are not the same as manufacturing output. Sources: BEA; BLS Current Employment Statistics, CES3232541201, CES3232540001 and CES3000000001.
A rare factory industry that held on — without getting much bigger
US manufacturing as a whole shrank. All-manufacturing payrolls averaged 17.42 million in 1997 and 12.79 million in 2024, a 27% decline. Against that backdrop, pharmaceutical plants were a relative haven: they did not collapse. Preparation manufacturing simply never built a workforce commensurate with a sixfold rise in the current-dollar medicine bill.
Selling the pills employs more people than making them. Pharmacies and drug retailers averaged 703,000 jobs in 2024, about three times the preparation-manufacturing payroll, before slipping to 674,000 in 2025.
| Year | Pharmaceutical products (current $bn) | Share of PCE | Preparation manufacturing (000) | Pharma and medicine manufacturing (000) | All manufacturing (millions) |
|---|---|---|---|---|---|
| 1997 | 102.3 | 1.85% | 186.0 | 235.9 | 17.42 |
| 2003 | 217.8 | 2.81% | 228.3 | 291.7 | 14.51 |
| 2016 | 423.0 | 3.32% | 202.3 | 286.2 | 12.32 |
| 2024 | 669.0 | 3.36% | 231.7 | 350.7 | 12.79 |
PCE is annual current dollars, United States. Employment figures are annual averages of seasonally adjusted monthly CES payrolls, in thousands except all manufacturing. Sources: BEA SAPCE4; BLS CES.
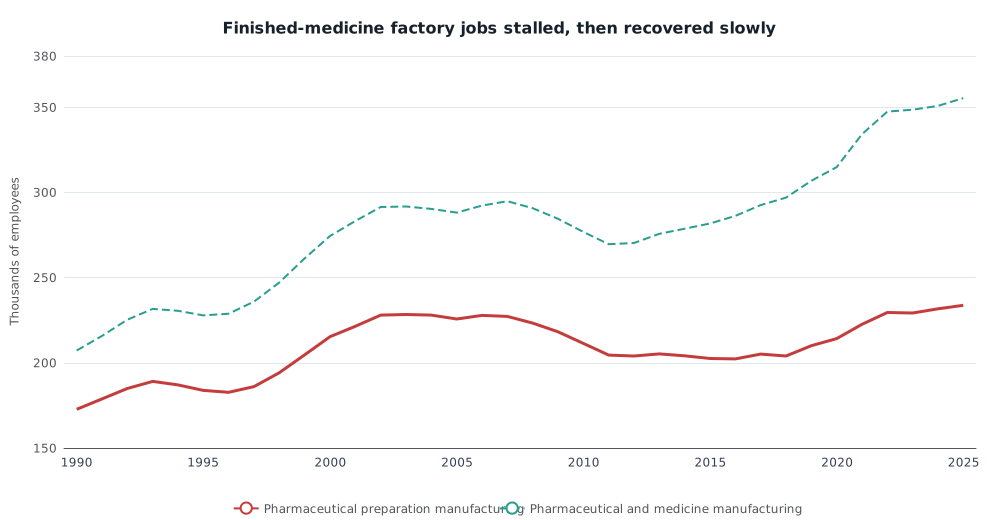
Annual average of seasonally adjusted monthly payrolls, thousands of employees, 1990–2025. Pharmaceutical preparation manufacturing is the finished-medicine factory series; pharmaceutical and medicine manufacturing is the broader industry. 2026 is omitted because the year is incomplete. Source: BLS CES, CES3232541201 and CES3232540001.
What a tariff in 2028 would be taxing
None of this measures the import share of US generic drugs, and none of it forecasts the price of a statin in 2029. A 100% duty on imported generics could still raise consumer prices, still fail to, or land unevenly across molecules; the payroll and PCE series cannot say. They also cannot say whether US plants are producing more with roughly the same number of people. Employment is not output.
What the series can say is narrower, and useful before the duty exists. The announced tariff is a production policy aimed at an industry whose finished-medicine factories, two decades after their early-2000s plateau, still employ about 230,000 people. The consumption bill those factories sit underneath is $669 billion a year, 3.4% of everything US households spend. If the political argument is that import taxes will rebuild a manufacturing base, that base is small relative to the bill, and it has been small for a long time.
Sources and methods
This is retrospective research written on 10 September 2026 about events reported on 22 July 2026. It uses later pinned statistical snapshots, not the releases that would have been in hand that July.
Spending comes from the BEA’s PCE by state by function (table SAPCE4), United States, millions of current dollars, annual, 1997–2024, from the 26 September 2025 SAPCE release in a 31 August 2026 data snapshot. “Pharmaceutical products” is the function-table line under household health consumption; it is not limited to generics or to imports. “Health” is the parent household-consumption function. Shares are calculated from those current-dollar totals.
Payrolls come from the BLS Current Employment Statistics national survey, all employees, seasonally adjusted, from a 24 August 2026 snapshot. Annual figures are unweighted means of the 12 monthly observations. Series used: pharmaceutical preparation manufacturing (CES3232541201), pharmaceutical and medicine manufacturing (CES3232540001), manufacturing (CES3000000001), pharmacies and drug retailers (CES4245611001), and total nonfarm (CES0000000001). June 2026 is the latest month for the pharmaceutical series; July 2026 is available for manufacturing and nonfarm. 2026 averages are not used as full-year comparisons.
The 100% generic-drug tariff and its 2028 start date are taken from France 24’s reporting; Dr Reddy’s warning is attributed reporting, not a finding of this analysis. Browser layout of the charts was not separately tested beyond SVG rendering.
Research Date
The displayed date matches the related news edition. Research was completed 2026-09-10.
Related news: Daily · 2026-07-22
More Research
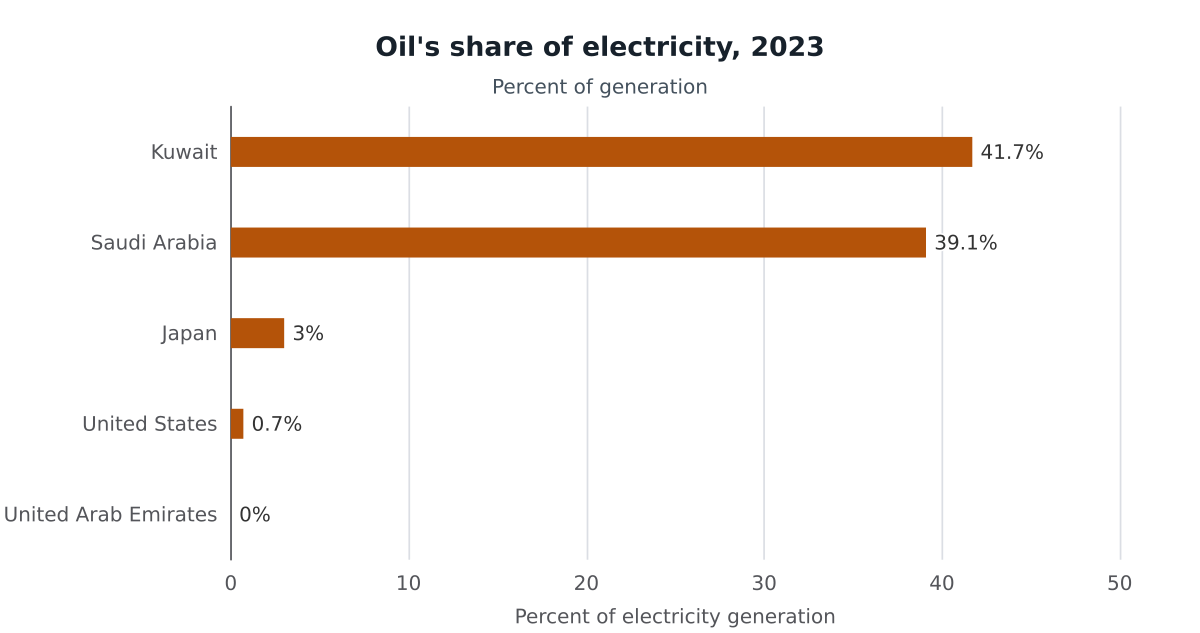
Saudi Arabia Still Generates Two-Fifths Of Its Electricity From Oil
In 2023 Saudi Arabia still generated 39 percent of its electricity from oil. The UAE already runs nuclear plants and has no oil residual on the grid.
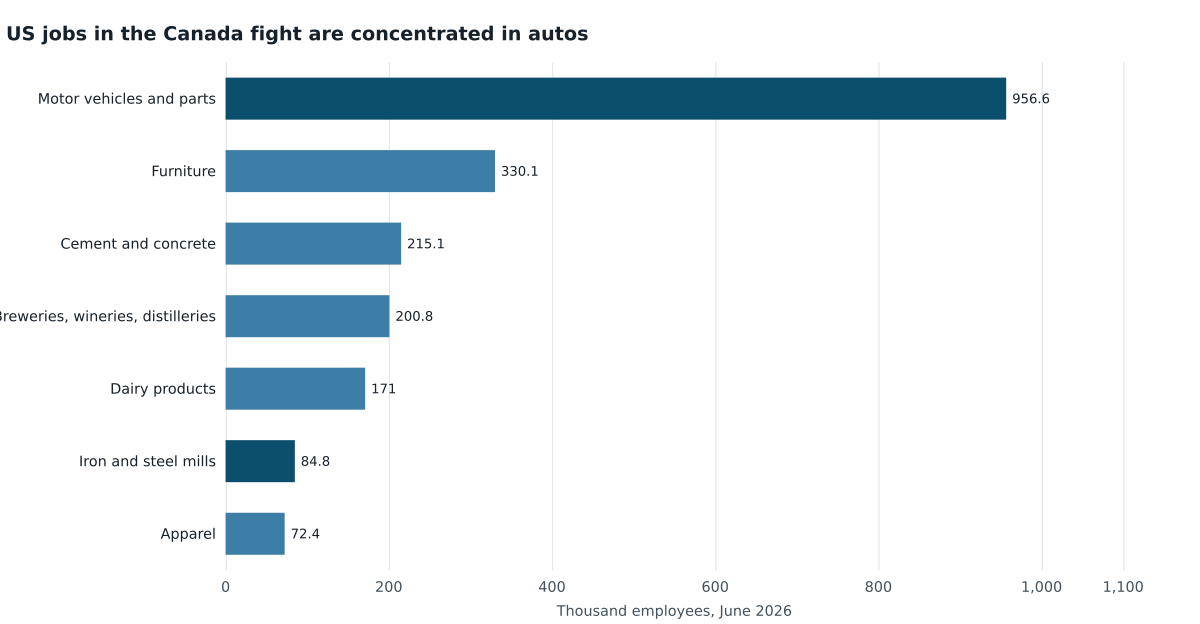
The New Canada Tariffs Are A Grab-Bag. The US Jobs Are In Cars.
A reported $20 billion US tariff list is 0.86 percent of Canada’s GDP but close to its current-account deficit. US payrolls in the fight sit in autos, not dairy.
The War Year Cut Palestinian Output By Nearly A Quarter
IMF accounts for the combined West Bank and Gaza show a 22.9 percent real-GDP drop in 2024, the worst year in the series, with no published 2025 output path.