LunarWeave
Russia’s War Economy Grew. The Boom Is Already Fading.
When the European Union’s foreign-policy chief said the bloc was preparing its most far-reaching sanctions on Russia yet, the implied story was familiar: squeeze the wartime economy until it cracks. The existing sanctions did not produce that crack in the output numbers. Russia’s real economy is larger than it was on the eve of the full-scale invasion. What the figures show instead is a short, hot boom that has already cooled to a crawl — and a country that grew while still losing ground on China.
The International Monetary Fund’s World Economic Outlook is the common yardstick here. It does not measure munitions, occupied territory or the quality of a wartime expansion. It does measure whether total real output shrank.
A dip, then a boom, then about 1 percent
Russia’s real GDP fell 1.4 percent in 2022. That is a recession, not a collapse. In 2015, after the first Crimea sanctions and an oil-price crash, output fell 2.0 percent. The later invasion year was milder in the national accounts.
Then the war economy ran hot. Real GDP rose 4.1 percent in 2023 and 4.9 percent in 2024, faster than the United States in both years and close to China in 2024. By 2024, constant-price output was 7.6 percent above 2021.
The IMF now sees that burst ending. It estimates 1.0 percent growth in 2025 and projects 1.1 percent in 2026. Those two years are not outturns; they are staff estimates and forecasts in the same file as the history. Even if they prove a little high or a little low, they describe a stall, not a crash.
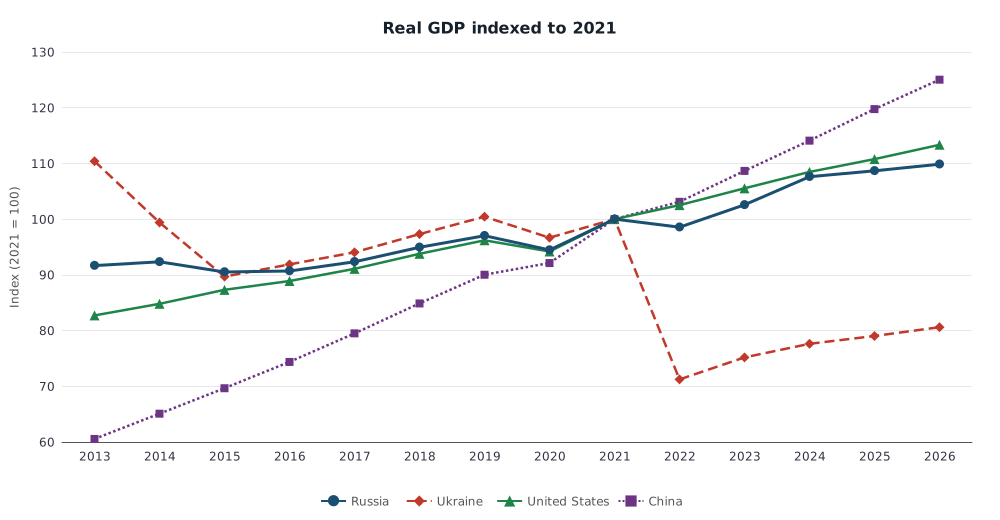
Real GDP in constant national-currency prices, rebased so 2021 equals 100. Russia, Ukraine, the United States and China; 2013–2026. Values for 2025–26 are IMF estimates/projections. Source: IMF World Economic Outlook. National-currency volume series are not converted at market exchange rates.
Put the four economies on the same 2021 baseline and the pattern is blunt. By 2026 the IMF puts Russia 9.9 percent above 2021. The United States is 13.4 percent higher. China is 25.0 percent higher. Ukraine is still 19.4 percent smaller.
| Economy | Real GDP, 2024 vs 2021 | Real GDP, 2026 vs 2021 (IMF projection) |
|---|---|---|
| Russia | +7.6% | +9.9% |
| United States | +8.5% | +13.4% |
| China | +14.1% | +25.0% |
| Ukraine | −22.4% | −19.4% |
The 2026 column includes IMF estimates and forecasts. The 2024 column does not.
Falling behind China is not the same as shrinking
In May, Andrei Klepach, then chief economist at the state development bank VEB, told fellow economists that Russia was “falling behind” China and the United States and, “in some respects,” Ukraine. The Guardian later reported that he was dismissed after those remarks. The output data support the first comparison and not the third, if “behind” means the size of the economy.
From 2021 to 2026, Russia’s share of world output at purchasing-power parity slips from 3.62 percent to 3.38 percent. China’s rises from 18.73 percent to 19.88 percent. The United States also loses share, from 15.10 percent to 14.54 percent, because China is still expanding faster than both. Russia grew and still became a slightly smaller slice of the world economy. That is relative decline, not a sanctions depression.
Ukraine is the other side of the ledger. Real GDP fell 28.8 percent in 2022. Subsequent growth — 5.5 percent in 2023 and 3.2 percent in 2024, with 1.8 and 2.0 percent in the IMF’s 2025–26 figures — leaves output about a fifth below the last pre-war year. From the 2022 trough through 2026, Ukraine’s rebound (13.1 percent) is a little faster than Russia’s (11.5 percent). That is the only sense in which Ukraine is “ahead,” and it is a rebound from a hole.
Even that per-person picture is entangled with who is still counted. IMF population for Ukraine drops from 41.0 million in 2021 to 34.5 million in 2022 and 32.3 million in 2026, a 21 percent decline. PPP GDP per person falls in 2022 and is projected slightly above its 2021 level by 2026, while total real GDP is not. A smaller counted population can lift the average without restoring the country. The IMF’s wartime population for Ukraine is a modelling construct — refugees, occupied territory and census gaps are not resolved here — so the per-capita rebound should not be read as living standards returning to normal.
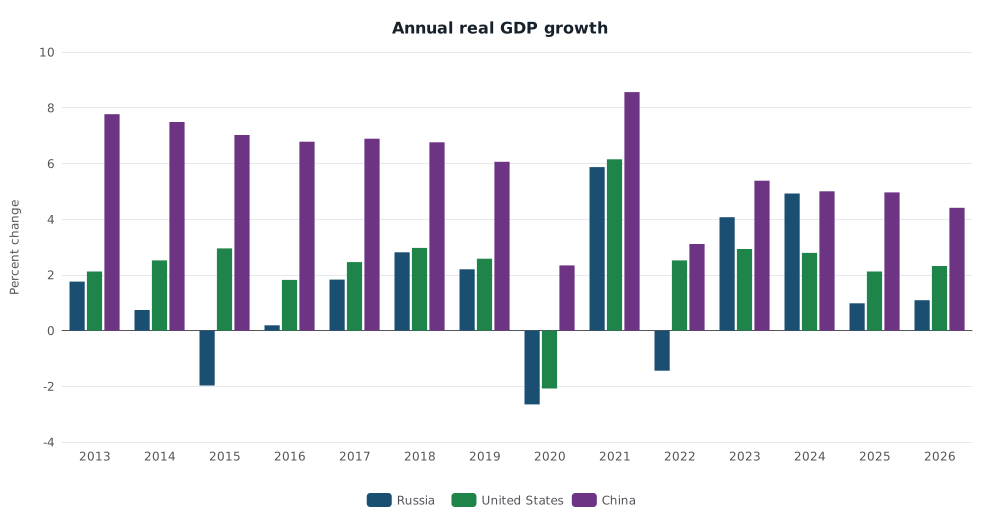
Annual percent change in real GDP. Russia, United States and China, 2013–2026. Ukraine is omitted because its 2022 decline of 28.8 percent would flatten the other series. Values for 2025–26 are IMF estimates/projections. Source: IMF World Economic Outlook.
The boom looked like a squeeze
If output did not collapse, something else did tighten. Russia’s unemployment rate fell from 4.0 percent in 2022 to 2.5 percent in 2024 and an estimated 2.2 percent in 2025. Average consumer-price inflation was 13.7 percent in 2022, still 8.4 percent in 2024 and an estimated 8.7 percent in 2025, before a projected 5.6 percent in 2026. A labour market that tight, with inflation still high, is the signature of an economy running out of spare people rather than spare demand.
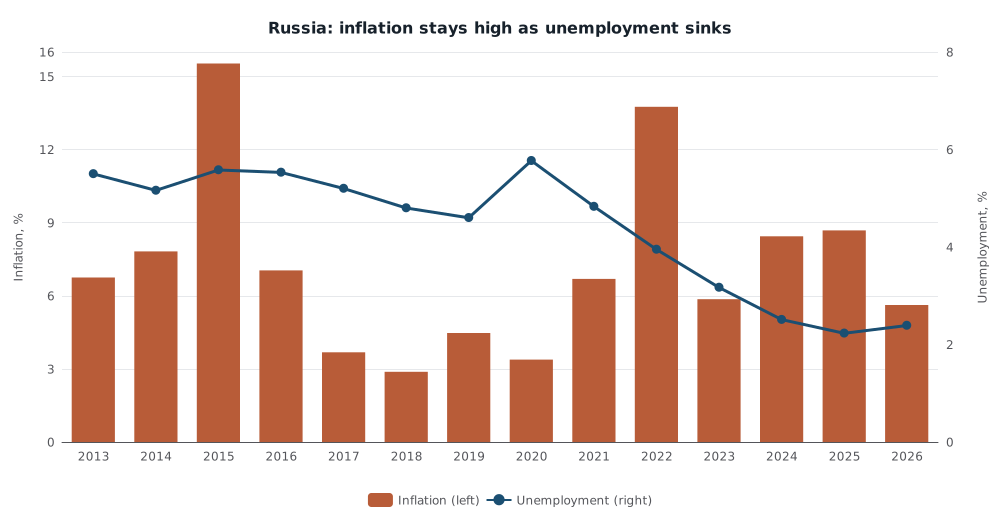
Russia average consumer-price inflation (percent change, left scale) and unemployment rate (percent, right scale), 2013–2026. Values for 2025–26 are IMF estimates/projections. Source: IMF World Economic Outlook. These are national labour-force and CPI measures, not a household cost-of-living index.
The external accounts tell the same cooling story. The current-account surplus jumped to 10.4 percent of GDP in 2022, then fell to 2.4 percent in 2023 and 2.9 percent in 2024, with 1.6 percent estimated for 2025. Total investment rose from 23.0 percent of GDP in 2021 to 27.3 percent in 2023. General-government spending moved only from 34.9 percent of GDP in 2021 to 36.7 percent in 2024 and an estimated 39.1 percent in 2025. Ukraine’s public spending, by contrast, leapt from 40.5 percent of GDP in 2021 to 65.4 percent in 2022 and 71.2 percent in 2024 — a state that has become the economy. Russia’s fiscal accounts still show a modest deficit (1.6 percent of GDP in 2024, 3.9 percent estimated in 2025) and low gross debt (14.8 percent of GDP in 2024). Those ratios do not capture the composition of spending, the hidden cost of conscription, or how long a tight labour market can feed a war.
None of this says sanctions were costless. They can reroute trade, raise the price of capital goods and push activity into military production that counts as GDP without raising civilian living standards. The IMF series cannot separate a tank from a washing machine. What they can rule out is the simple claim that Russia’s total real output is smaller than before the invasion.
The next round of European sanctions will arrive in that setting: an economy that already absorbed the first shock, grew through a mobilisation boom, and is now slowing toward 1 percent with almost no unemployment left to squeeze. If the aim is to shrink Russia’s measured output below 2021, the existing measures have not done it. If the aim is to keep Russia from matching China’s expansion, that relative gap was opening anyway.
Methods and sources
This is retrospective research completed on 10 September 2026, using the pinned IMF World Economic Outlook snapshot ingested on 10 August 2026. The digest date is 17 August 2026; later releases are not treated as having been known that day. Figures for 2024 and earlier are treated as historical outturns, subject to revision. Figures for 2025 and 2026 are IMF estimates and projections. Real GDP comparisons use each country’s constant-price series in national currency, indexed to 2021; they are not dollar conversions. World shares are purchasing-power-parity weights. Portal pages for growth, world share and unemployment match the research snapshot on the Russia points checked; they are IMF republished on MacroVedia, not a substitute for the Fund. Browser layout of the charts was not separately tested beyond SVG rendering.
Research Date
The displayed date matches the related news edition. Research was completed 2026-09-10.
Related news: Daily · 2026-08-17
More Research
$90 Oil Is A Shock Against Last Year, Not Against History
A $90 Brent print after the US-Iran ceasefire lapsed is a break with 2025’s $68 average and the IMF’s $80 assumption for 2026 — not a return to 2022’s $99 year.
Brazil Is Barely Richer Per Person Than It Was In 2013
IMF accounts show Brazil recrossed 2013 real output per person only in 2024, while 2022’s inflation spike has receded.
The $40 Trillion Debt Milestone Is A Bigger Dollar Economy, Not A Second 2020
The Treasury $40 trillion print is a dollar stock. IMF general-government accounts show the US debt ratio still below its 2020 peak, with interest now about half of a deficit that remains a