LunarWeave
$90 Oil Is A Shock Against Last Year, Not Against History
When a US-Iran ceasefire window closed in mid-August 2026, Brent crude traded above $90 a barrel and government bond yields rose in the United States, Britain, Germany, France and Japan. The market story was familiar: a shut Strait of Hormuz, dearer oil, a worse inflation outlook, and more expensive public borrowing.
The annual record in the IMF World Economic Outlook says something less cinematic. A year that averaged $90 would not match 2022, let alone the early-2010s peak. It would be a reversal from last year’s $68 average, and it would sit above the oil price the IMF still has written into its 2026 baseline. The scare is the turn, not a new high-water mark.
A $90 year is uncommon. It is not a record.
IMF Brent figures are annual averages in dollars per barrel, stored on the WEO world aggregate. They are not daily spot prints. Treating $90 as a full-year average is therefore a stricter test than a single session: the year has to stay expensive, not merely spike.
On that test, $90 is unusual without being extreme. In the 46 years from 1980 through 2025, only six averaged at least $90: 2008, 2011–14 and 2022. The highest annual average is 2012, at $112.01, not the 2008 crisis year ($97.33). 2022, the last global inflation scare, averaged $99.00. A $90 year would still be about $9 below that, and about $22 below the 2012 peak.
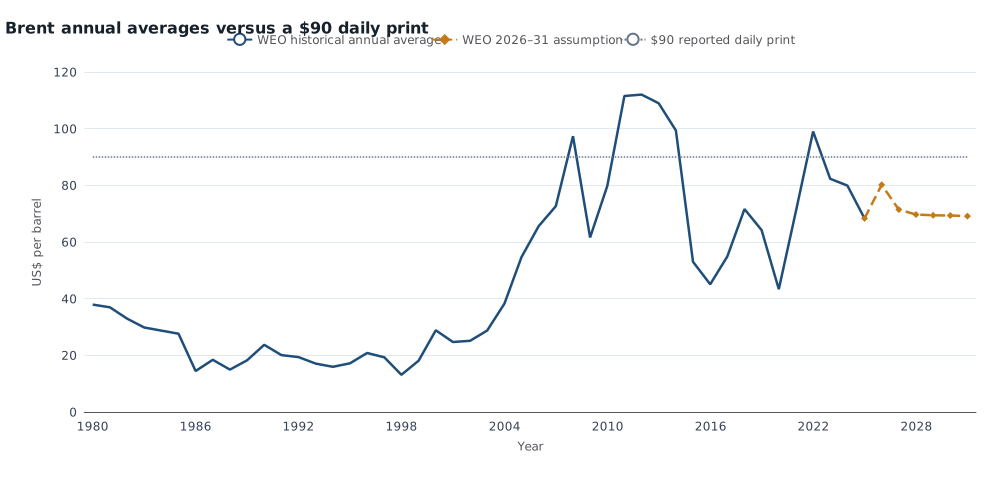
IMF World Economic Outlook Brent crude, US dollars per barrel, annual average, world aggregate (WEO group 001). Solid line: 1980–2025 historical annual averages. Dashed line: 2026–2031 WEO price assumptions in the pinned snapshot. Dotted line: $90, the reported daily print on 18 August 2026 — not an annual average and not an IMF observation.
Last year is the better comparison. 2025 averaged $68.32, a 31 percent drop from 2022. That is not historically cheap — it is still the 13th-highest annual average in the 1980–2025 sample, and well above the period median of about $37 — but it is a long way from a $90 or $99 year. A $90 print is 32 percent above 2025’s average.
The IMF’s broader energy price index tells the same cooling story. It peaked in 2022, then fell 46 percent by 2025.
The official script still fades after 2026
In this WEO snapshot, the 2026 Brent assumption is $80.19 — 17 percent above 2025, and still 12 percent below a $90 year. The path after that is not a new plateau. The Fund’s assumptions drop to $71.45 in 2027 and then hover near $69 through 2031.
| Year | Brent, $/barrel | In this snapshot |
|---|---|---|
| 2008 | 97.33 | Historical annual average |
| 2012 | 112.01 | Historical peak |
| 2022 | 99.00 | Historical annual average |
| 2025 | 68.32 | Historical annual average |
| 2026 | 80.19 | WEO assumption |
| 2027 | 71.45 | WEO assumption |
A single day above $90 does not rewrite a year. If prices fall back, 2026 can still average near the IMF’s $80. If they stay there, the year would overshoot the baseline the Fund is using for growth, inflation and fiscal arithmetic — without matching the 2022 annual price, and without matching the 2011–13 stretch when Brent averaged more than $100 for three consecutive years.
Inflation had already cooled in four of the five yield-spike countries
The yield move was reported as a bet on a worse inflation outlook. Annual average consumer-price inflation in the same five countries had, with one exception, already retraced most of the 2022 burst. Readers need to choose the country in the chart selector; the figures below are the WEO series, not a live portal default.
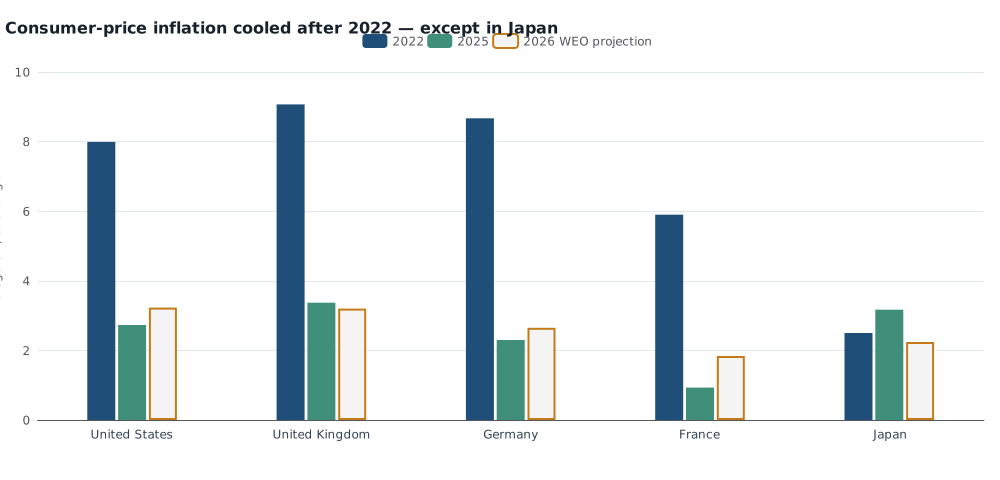
IMF WEO average consumer-price inflation, percent change. 2022 and 2025 are historical annual figures in the pinned snapshot; 2026 is a WEO projection, shown with an outline fill. Japan is the exception: its 2025 rate is higher than 2022. These are annual averages, not monthly prints, and they do not isolate oil’s contribution to inflation.
In 2022, average CPI inflation was 8.0 percent in the United States, 9.1 percent in the United Kingdom, 8.7 percent in Germany and 5.9 percent in France. By 2025 those rates were 2.7, 3.4, 2.3 and 0.9 percent. Japan did not follow: 2.5 percent in 2022, 3.2 percent in 2025.
The WEO’s 2026 inflation projections barely twitch. The United States ticks up to 3.2 percent; Germany to 2.7 percent; France to 1.8 percent. Britain eases slightly to 3.2 percent; Japan to 2.2 percent. Those are not 2022-style rates, and they are not a forecast of what a sustained $90 oil year would do: the WEO does not split consumer prices into an oil component. What they show is the starting point. Four of the five governments watching their borrowing costs jump had already spent three years pulling inflation down from the 2022 energy-price spike. Japan is the country where that disinflation had not happened.
The debt stock is heavier than it was before the last shock
High yields bite harder when the debt they reprice is larger. General government gross debt as a share of GDP is not this week’s bond yield, and it is not net debt after financial assets. It is the stock that has to be rolled and serviced.
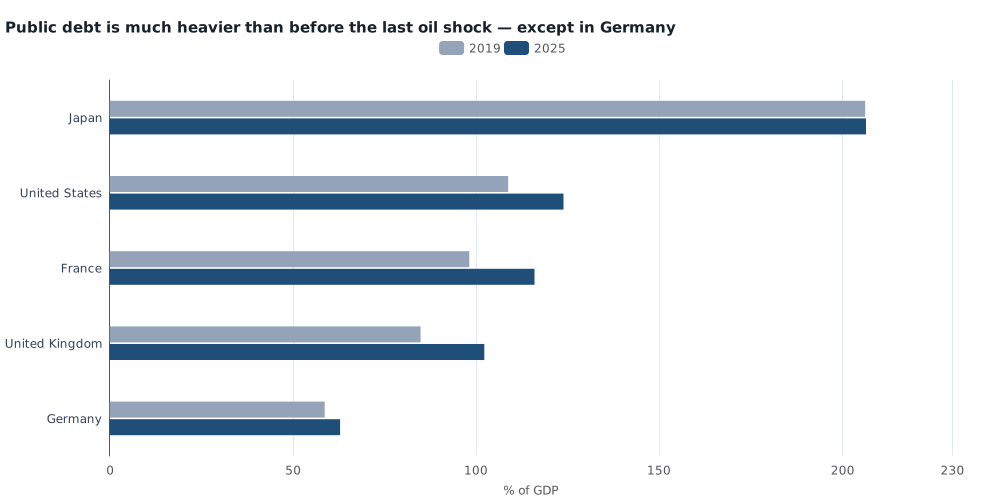
IMF WEO general government gross debt, percent of GDP, 2019 versus 2025. Japan’s ratio was already above 200 percent in 2019. Germany’s 2025 ratio remains near 63 percent. Gross debt is not net debt or interest expense.
In 2025, Japan’s gross debt was 207 percent of GDP, the United States 124 percent, France 116 percent and the United Kingdom 102 percent. Germany was the outlier at 63 percent. Relative to 2019, before the pandemic and the last oil shock, the US, British and French ratios are each about 15–18 percentage points higher. Japan was already above 200 percent then. Germany’s increase is about four points.
That is why a common yield backup is not a common fiscal event. Germany is watching the same oil headline with a much smaller public debt ratio. Japan is watching it with a ratio that was already in a different league. The WEO does not say how much of each country’s debt re-prices this month, or who holds it.
The useful reading of $90
Put the pieces together and August’s oil print is a regime test, not a record. Annual Brent has been higher, for longer, without matching today’s debt ratios in the United States, Britain and France. Last year’s $68 average, and the IMF’s $80 assumption for 2026, are the levels a sustained $90 would break. Inflation in four of the five yield-spike countries had already come down from 2022; the Fund’s 2026 inflation projections do not assume it goes back.
None of that measures barrels stuck in Hormuz, gasoline at the pump, or the path of bond yields. It does say what kind of oil shock this would have to become, in annual terms, before it looked like the last one.
Sources and methods
This is retrospective research, written on 10 September 2026 about events reported on 18 August 2026. It uses a pinned IMF World Economic Outlook snapshot packaged on 10 August 2026 and normalized on 24 August 2026, which may include later revisions than were public on the news day. Observation dates are not release dates.
Brent is WEO series POILBRE, US dollars per barrel, annual average, geography G001 (WEO world). The energy price index is PNRGW. Inflation is average consumer prices, percent change (PCPIPCH). Gross debt is general government gross debt, percent of GDP (GGXWDG_NGDP). Years 2026–2031 are WEO assumptions or projections in this snapshot, not realized outcomes; 2025 inflation and debt may still be revised. The $90 figure is a reported daily Brent print, not an IMF annual observation. Commodity-price indexes are used only as percent changes because the snapshot does not state a base year. No browser or mobile layout check was done beyond SVG rendering. Official figures: IMF World Economic Outlook.
Research Date
The displayed date matches the related news edition. Research was completed 2026-09-10.
Related news: Daily · 2026-08-18
More Research
The $40 Trillion Debt Milestone Is A Bigger Dollar Economy, Not A Second 2020
The Treasury $40 trillion print is a dollar stock. IMF general-government accounts show the US debt ratio still below its 2020 peak, with interest now about half of a deficit that remains a
Russia’s War Economy Grew. The Boom Is Already Fading.
IMF accounts show Russia’s real GDP above 2021 after a 2023-24 wartime boom, now slowing toward 1 percent as the EU prepares tougher sanctions.
Israel Is Still Growing. The War’s Scar Is In The Economy.
IMF population data show Israel still adding people in 2024. The war years show up in stalled output and an 8 percent-of-GDP deficit, not in a shrinking country.