LunarWeave
The $40 Trillion Debt Milestone Is A Bigger Dollar Economy, Not A Second 2020
When US gross national debt crossed $40 trillion in August 2026, the number did what round numbers do: it invited a crisis story. The Treasury’s daily total had been $30 trillion as recently as January 2022. Less than five years, another $10 trillion, long-term yields at a 20-year high, and a “doom loop” in which interest costs feed more borrowing.
The dollar stock is real. So is the interest-rate pressure the Treasury was trying to soothe with larger buybacks. What the round number does not tell you is whether the burden — debt relative to the economy that has to service it — exploded on the same timetable. In the IMF’s general-government accounts, it did not.
Those IMF figures are not the Treasury daily print. They cover general government (federal plus state and local, on the Fund’s definition), they are annual, and they do not include every intra-governmental Treasury security that sits inside the $40.047 trillion headline. They are the series built for comparing the United States with other countries over time. On that yardstick, the years in which the dollar stock raced from the low thirties of trillions toward $40 trillion look much less like 2020.
A 23 percent jump in the stock, a 5-point move in the ratio
From 2022 to 2025, IMF general-government gross debt rose from $31.04 trillion to $38.12 trillion, a 22.8 percent increase. Over the same years, US current-dollar GDP rose from $26.05 trillion to $30.77 trillion, or 18.1 percent. The ratio — the burden — went from 119.1 percent of GDP to 123.9 percent. That is 4.7 percentage points.
Most of the extra dollars were the arithmetic of a larger nominal economy. Of the $7.07 trillion added to the IMF debt stock, $1.46 trillion is the amount beyond the path that would have held the 2022 ratio constant — about a fifth of the increase. The other four-fifths kept pace with GDP.
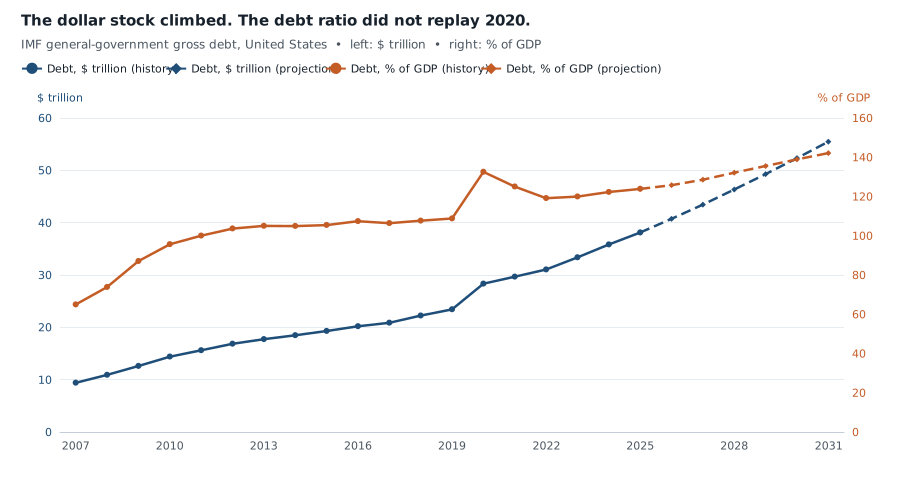
IMF general-government gross debt for the United States, 2007–2031. Left axis: stock in trillion current US dollars. Right axis: percent of GDP. Solid lines are history through 2025 in this vintage; dashed lines are IMF staff projections. This is not the Treasury daily total. Source: IMF World Economic Outlook.
The 2020 shock was a different animal. The debt ratio jumped 23.8 points in a single year, from 108.8 percent in 2019 to 132.6 percent in 2020, as GDP contracted and emergency spending opened a 14.1 percent-of-GDP deficit. By 2022 the ratio had already fallen back to 119.1 percent. 2025, at 123.9 percent, is still 8.7 points below that peak. The United States is more indebted than before the pandemic. It is not more indebted, relative to GDP, than it was at the height of the pandemic.
Net debt, which subtracts financial assets, was 96.7 percent of GDP in 2025 — a reminder that the gross ratio and the Treasury headline are both upper-bound ways of counting.
None of this makes $40 trillion imaginary. In this IMF vintage, staff already projected 2026 general-government debt at $40.73 trillion, or 125.8 percent of GDP. The projection is an annual forecast, not a confirmation of Tuesday’s Treasury statement, and it continues to drift up. The point is narrower: the round-number crossing is what you get when a large economy keeps adding debt in an expanding dollar GDP. It is not, by itself, evidence that 2022–2025 replayed 2020.
Interest is half the hole. The other half is still a choice.
The more serious change sits in the budget, not in the ratio.
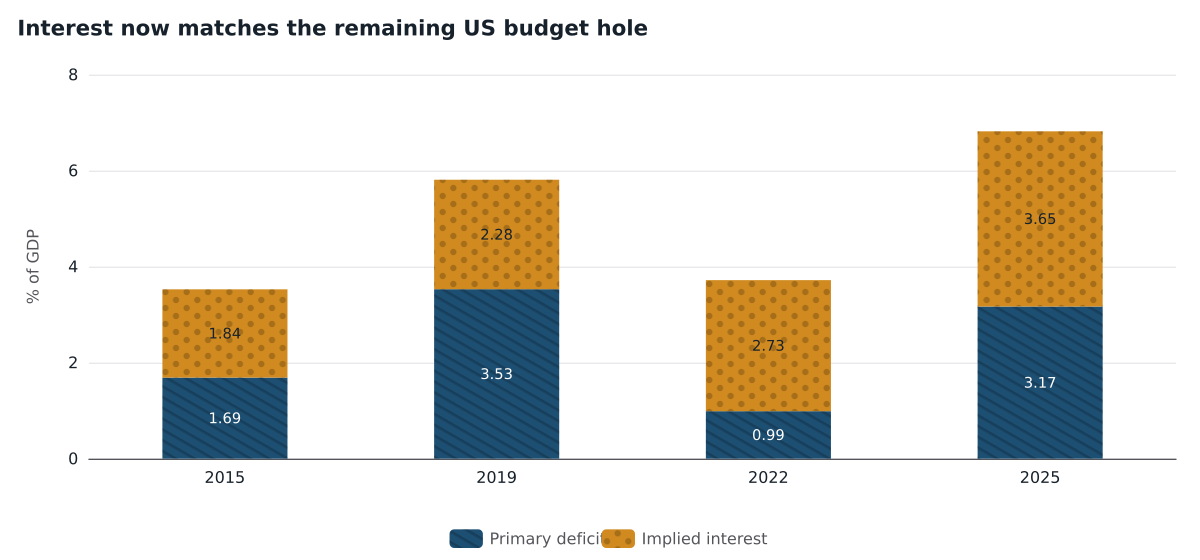
The IMF’s overall general-government balance (net lending/borrowing) was −6.8 percent of GDP in 2025. The primary balance — the same accounts excluding interest, series GGXONLB_NGDP — was −3.2 percent. The gap between them, 3.7 percent of GDP, is implied interest. That implied interest bill was 2.0 percent of GDP in 2020 and 2.7 percent in 2022. It is now just over half (54 percent) of the overall deficit.
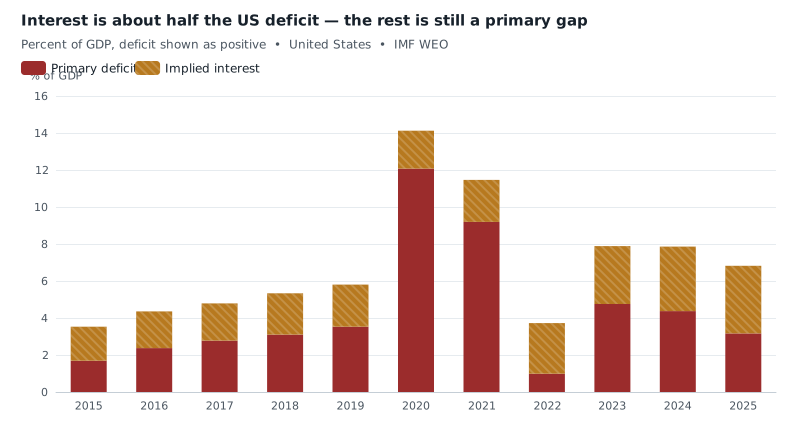
US general-government deficit as a percent of GDP, 2015–2025. Primary deficit is IMF GGXONLB_NGDP with the sign reversed; implied interest is the primary balance minus the overall balance. The stack equals the overall deficit. 2025 is the latest complete year in this vintage. Source: IMF World Economic Outlook.
That is the grain of truth in the doom-loop framing: once debt is large, higher yields show up as a bigger slice of each year’s borrowing. It is not the whole story. A primary deficit of 3.2 percent of GDP means the government was still spending more than it collected before interest. In 2019 that primary gap was 3.5 percent of GDP. The United States did not close the pre-interest hole after the pandemic; it added a heavier interest bill on top.
The 2025 deficit is not a cyclical accident. Real GDP grew 2.1 percent that year, and the structural balance was −7.2 percent of potential GDP. Revenue was 30.9 percent of GDP, against 30.0 percent in 2019; expenditure was 37.7 percent, against 35.8 percent. The gap widened on the spending side, with only a modest revenue offset.
Italy shows the other pattern. In 2025 it ran a primary surplus of 0.5 percent of GDP and still posted an overall deficit, because interest on a larger debt stock ate the surplus. The United States has the interest problem without the primary surplus.
Other large economies are not all on the same path
From 2022 to 2025, the US debt-ratio increase was ordinary among rich peers, not extreme:
| Country | Debt ratio 2022 | Debt ratio 2025 | Change, points | Primary balance 2025 |
|---|---|---|---|---|
| Canada | 103.5 | 113.5 | +10.0 | −2.1 |
| United Kingdom | 97.5 | 102.3 | +4.8 | −2.8 |
| United States | 119.1 | 123.9 | +4.7 | −3.2 |
| France | 111.4 | 116.0 | +4.6 | −3.1 |
| Italy | 138.4 | 137.1 | −1.3 | +0.5 |
| Germany | 64.4 | 62.9 | −1.5 | −1.8 |
| Japan | 227.8 | 206.5 | −21.3 | −0.9 |
Figures are IMF general-government gross debt and primary balance (GGXONLB_NGDP), percent of GDP. 2025 is the latest complete year in this vintage, not a forecast year.
Japan’s ratio fell by 21 points as its deficit shrank and nominal GDP grew; implied interest there remains tiny, so a huge stock has not become a huge annual bill. Canada’s ratio rose twice as fast as the United States’. The US combination that matters is the one in the last column plus the interest slice: a primary deficit still above 3 percent of GDP, meeting borrowing costs that have already doubled as a share of the economy since 2020.
That is a worse mix than a round dollar total. It is also a slower-burning one than the 2020 spike. IMF staff in this snapshot still see the ratio climbing through the early 2030s if policy stays on the projected path. Whether that path is a “loop” depends on rates, growth, and whether the primary gap stays open — questions the $40 trillion print cannot settle.
What the evidence can settle is the headline. The Treasury crossing is a fact about a daily stock of dollars. In the IMF books, the United States added a lot of those dollars after 2022 mainly because it is a large, still-growing nominal economy. The burden rose a few points, not a few dozen. The part of the budget that actually changed is the interest bill — and it changed on top of a primary deficit the country had already chosen.
Methods and sources
This article is retrospective. The news dates to 19 August 2026; the calculations use an IMF World Economic Outlook snapshot frozen on 24 August 2026 (raw run 10 August 2026) and were made on 10 September 2026. Later revisions are not reconstructed as-of that Tuesday.
Debt, GDP and budget figures are annual IMF series, not the Treasury daily “total public debt outstanding.” 2025 is the latest complete year in the vintage; 2026–2031 are staff projections and are labelled as such. Implied interest is derived as the primary balance minus the overall balance. That identity is used only where both series exist; it is not a published interest-expenditure line. The local catalogue mislabels GGXONLB_NGDP as a structural balance; the IMF code and the arithmetic with net lending/borrowing identify it as a primary balance, and it is used that way here. GGSB_NPGDP is the structural balance (percent of potential GDP).
Browser and mobile layout of the charts were not separately tested beyond SVG rendering.
Research Date
The displayed date matches the related news edition. Research was completed 2026-09-10.
Related news: Daily · 2026-08-19
More Research
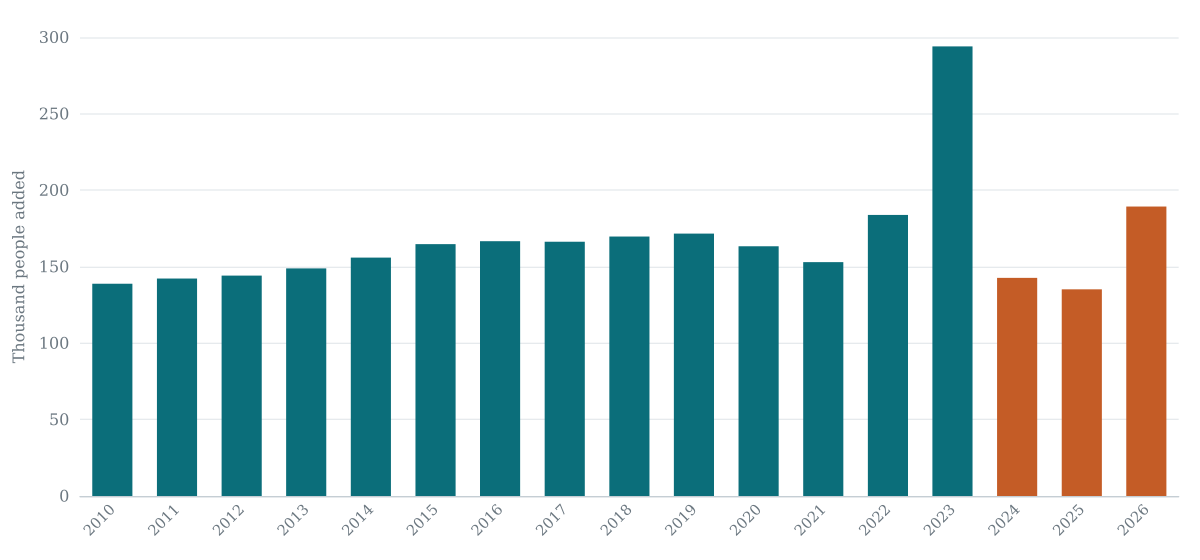
Israel Is Still Growing. The War’s Scar Is In The Economy.
IMF population data show Israel still adding people in 2024. The war years show up in stalled output and an 8 percent-of-GDP deficit, not in a shrinking country.
$90 Oil Is A Shock Against Last Year, Not Against History
A $90 Brent print after the US-Iran ceasefire lapsed is a break with 2025’s $68 average and the IMF’s $80 assumption for 2026 — not a return to 2022’s $99 year.
Half Of America’s Budget Hole Is Now Interest. The Rest Never Closed.
IMF books show the 2025 US general-government deficit split almost evenly between a still-open primary gap and a larger interest bill — a different story from the $40 trillion headline.