LunarWeave
Brazil Is Barely Richer Per Person Than It Was In 2013
Luiz Inácio Lula da Silva, now 80, has launched a campaign for a fourth presidential term. The Guardian reported that he told supporters in São Bernardo do Campo he would not hand the country back to the “shameless” right as long as he lived. His October opponent is Flávio Bolsonaro, son of the jailed former president; France 24 described the two camps as running close in the polls.
The last time these families faced each other at the ballot box, in 2022, consumer prices were rising at their fastest annual rate in a decade. That is not the economy Brazil is voting on now. What has not disappeared is a slower injury: real output per person spent ten years below its 2013 peak and recrossed that line only in 2024.
A peak that took a decade to retake
In the IMF’s World Economic Outlook, Brazil’s real GDP per person — output per capita at constant prices — rose 35% between 2003 and 2013. Then it stopped. After a shallow dip in 2014, the 2015–16 recession cut the series by 8.4% from the 2013 high. Covid took it lower still. By 2020, real output per person was 9.8% below 2013, the trough of the entire 2003–2024 span.
The 2022 election arrived with the country still 3.5% poorer per person than in 2013. 2023 almost closed the gap. 2024 was the first year the series moved back above the old peak, by 2.2%. Total real GDP was already 9.1% larger than in 2013; population growth absorbed most of the difference. These figures are averages. They are not household income, median wages or poverty rates, and they do not prove that any president caused the path.
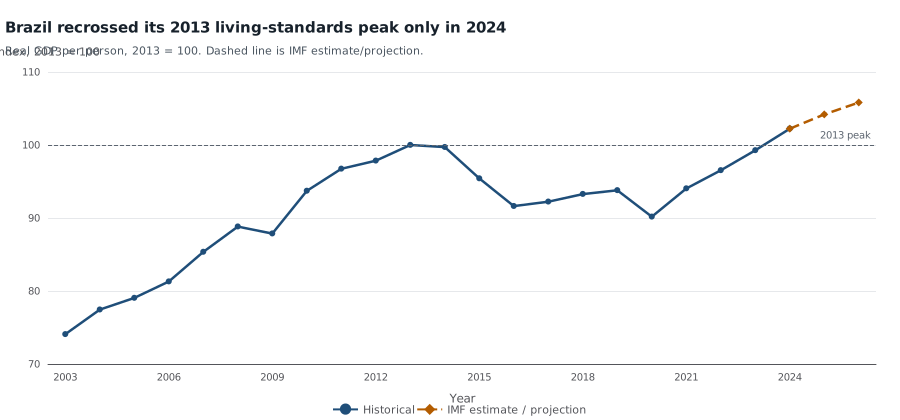
Brazil real GDP per capita at constant prices, 2013 = 100. The series is below 100 from 2014 through 2023 and reaches 102.2 in 2024. 2025 is an IMF estimate; 2026 is a projection. Source: IMF World Economic Outlook (NGDPRPC). Choose Brazil on the constant-price GDP-per-capita series page; the index is a calculation from that series, not a separate IMF table.
The IMF’s 2025 estimate and 2026 projection continue the climb, to 104.2 and 105.8 on the same index. Those later points are not yet history.
The 2022 inflation emergency has receded
Average consumer-price inflation, the IMF’s headline annual percentage change, was 9.3% in 2022 — the highest reading since 2015–16. It fell to 4.4% in 2024. That is still above the 3.5% average of 2017–20, and the Fund’s 2025 estimate ticks back up to 5.0% before a 4.0% projection for 2026. Prices are no longer running at 2022 speed. They have not returned to the pre-pandemic crawl either.
Jobs moved further. The unemployment rate peaked at 13.8% in 2020 and was 9.25% in 2022. In 2024 it was 6.9%, matching 2014, the lowest calendar year in the IMF series from 2000 through 2024. The 2025 estimate, 6.0%, would be lower still; treat that as an IMF figure, not a settled labour-market fact.
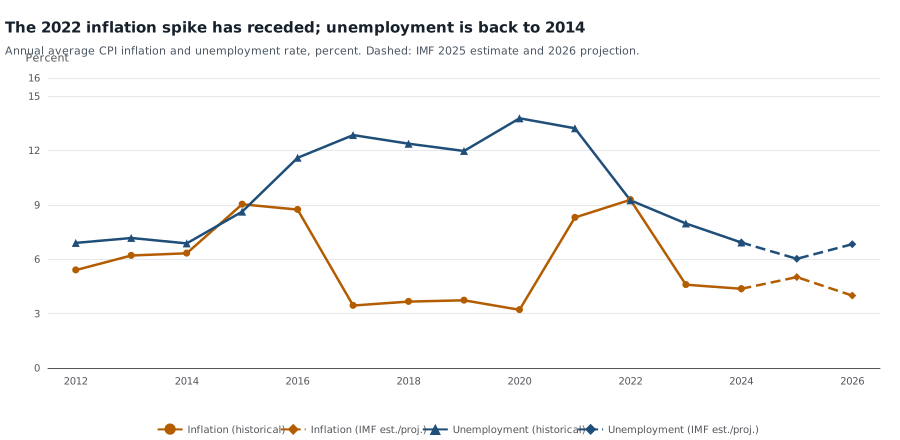
Annual average CPI inflation (percent change) and unemployment (percent of the labour force). Both are percentages; they are not the same quantity and are not additive. Dashed segments are the IMF’s 2025 estimate and 2026 projection. Sources: IMF WEO inflation and unemployment. Select Brazil in each chart.
The combination matters for the campaign. A voter in 2022 faced high inflation and unemployment still near 9%. A voter in 2026 faces inflation closer to 4–5% and unemployment back around its 2014 low — on a living-standards level that only just recrossed 2013.
Neighbours did not lose the same decade
The same constant-price PPP measure of GDP per person, indexed to each country’s own 2013 level, shows how unusual Brazil’s 2015–16 collapse was among large South American peers. By 2016, Chile, Mexico, Peru and Colombia were already above their 2013 marks. Brazil was at 91.6. Argentina, in a longer decline of its own, was at 94.9.
In 2024, Colombia stood at 114.8, Peru at 110.5, Chile at 109.0 and Mexico at 105.6. Brazil was 102.2 — richer than in 2013, but only just, and later than those four. Argentina remained at 88.1 and had not recrossed 2013 at all. Crossing 100 is not a welfare ranking: Colombia’s 15% gain from a lower starting level is not the same as Chile’s 9% gain from a higher one. It is a recovery clock.
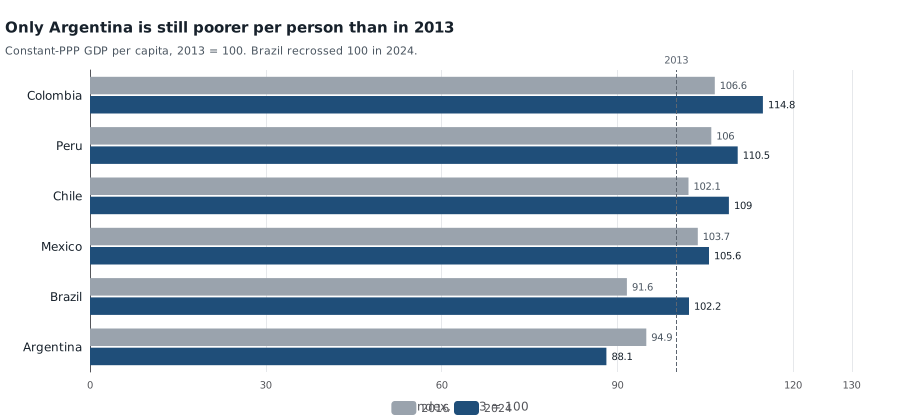
Constant-PPP GDP per capita, 2013 = 100. Grey: 2016. Navy: 2024. Source: IMF WEO NGDPRPPPPC. Select each country in the chart; 2013 = 100 is calculated from that series.
Public finances did not heal with the labour market
Real GDP grew 3.2% in 2023 and 3.4% in 2024, after contractions of 3.5% and 3.3% in 2015 and 2016. The IMF then sees growth slowing to 2.3% in 2025 and 1.9% in 2026.
The budget did not tighten with that recovery. General-government net lending was −4.0% of GDP in 2022, then −7.7% in 2023 and −6.2% in 2024. The Fund’s 2025 estimate is −8.1%. Gross government debt fell from 96.0% of GDP in 2020 to 83.9% in 2022, then climbed again: 87.0% in 2024, with 93.3% estimated for 2025 and 96.5% projected for 2026 — back to the pandemic high. Debt ratios move with both borrowing and the GDP denominator; they are not a household bill.
| Year | GDP per person (2013=100) | Inflation (%) | Unemployment (%) | Growth (%) | Debt (% of GDP) | Budget balance (% of GDP) |
|---|---|---|---|---|---|---|
| 2013 | 100.0 | 6.2 | 7.2 | 3.0 | 59.6 | −3.4 |
| 2016 | 91.6 | 8.7 | 11.6 | −3.3 | 77.4 | −8.0 |
| 2020 | 90.2 | 3.2 | 13.8 | −3.3 | 96.0 | −11.6 |
| 2022 | 96.5 | 9.3 | 9.2 | 3.0 | 83.9 | −4.0 |
| 2024 | 102.2 | 4.4 | 6.9 | 3.4 | 87.0 | −6.2 |
| 2025* | 104.2 | 5.0 | 6.0 | 2.3 | 93.3 | −8.1 |
| 2026* | 105.8 | 4.0 | 6.8 | 1.9 | 96.5 | −7.7 |
*2025 is an IMF estimate and 2026 a projection in this snapshot. Inflation is average CPI; unemployment is the labour-force rate; growth is constant-price GDP; the budget line is general-government net lending/borrowing. One-decimal figures are rounded from the extracts.
What the accounts can and cannot say
The October election will not be decided by an IMF table. It will be decided by voters who experienced the 2015–16 slump, the 2022 price spike, and a labour market that has since tightened. The accounts say those are no longer the same emergency. They also say Brazil did not get a new prosperity: it got back, barely, to where it was twelve years earlier, while public debt is heading toward its covid peak as growth is projected to cool.
That is not a verdict on Lula, Jair Bolsonaro or Flávio Bolsonaro. Commodity cycles, covid, fiscal rules and monetary policy all sit inside the same annual numbers. The IMF series used here have no poverty, inequality or regional split, and 2025–26 should not be read as facts already in the bank.
Methods and sources. This is retrospective research completed on 10 September 2026 about reporting from 16 August 2026. It uses the IMF World Economic Outlook in the pinned MegaVedia snapshot dated 24 August 2026 (raw ingest 10 August 2026), which can include later revisions than were public on digest day. Years through 2024 are treated as historical WEO values, still open to revision; 2025 as an estimate; 2026 as a projection. Brazil’s living-standards path is constant-price GDP per capita (NGDPRPC) indexed to 2013. Peer comparisons use constant-PPP GDP per capita (NGDPRPPPPC), which matches Brazil’s NGDPRPC index in this snapshot but is the series that can be compared across countries. Official documentation: IMF World Economic Outlook. SVG charts were rendered with ECharts; layout was not separately tested in a browser.
Research Date
The displayed date matches the related news edition. Research was completed 2026-09-10.
Related news: Daily · 2026-08-16
More Research
Russia’s War Economy Grew. The Boom Is Already Fading.
IMF accounts show Russia’s real GDP above 2021 after a 2023-24 wartime boom, now slowing toward 1 percent as the EU prepares tougher sanctions.
Russia Is Larger Than Before The Invasion. The War Boom Is Over.
IMF accounts show Russia’s 2023–24 war boom slowing to about 1 percent growth, not an output collapse.
$90 Oil Is A Shock Against Last Year, Not Against History
A $90 Brent print after the US-Iran ceasefire lapsed is a break with 2025’s $68 average and the IMF’s $80 assumption for 2026 — not a return to 2022’s $99 year.