LunarWeave
Russia Is Larger Than Before The Invasion. The War Boom Is Over.
Andrey Klepach is not an opposition economist. He is the chief economist of VEB.RF, the state development bank that finances Kremlin national projects. In mid-August he told a Moscow audience that Russia cannot win a “war of attrition” against a Ukraine backed by the West, is losing technological and economic competition with China and the United States — “in some respects” even with Ukraine — and is heading for a social crisis. After the military boom of 2023–24, he said, the economy had shifted to a decline.
Those are consequential claims. They are also more specific than a cartoon of collapse. The International Monetary Fund’s World Economic Outlook accounts, read against them, show a war economy that ran hot, then stalled. They do not show an output crash.
A boom, then about 1 percent
Russia’s real GDP contracted 1.4 percent in 2022, the year of the full-scale invasion. It then expanded 4.1 percent in 2023 and 4.9 percent in 2024 — a two-year compound gain of 9.2 percent. In the Fund’s figures, that burst is over. Growth slows to 1.0 percent in 2025 and a projected 1.1 percent in 2026.
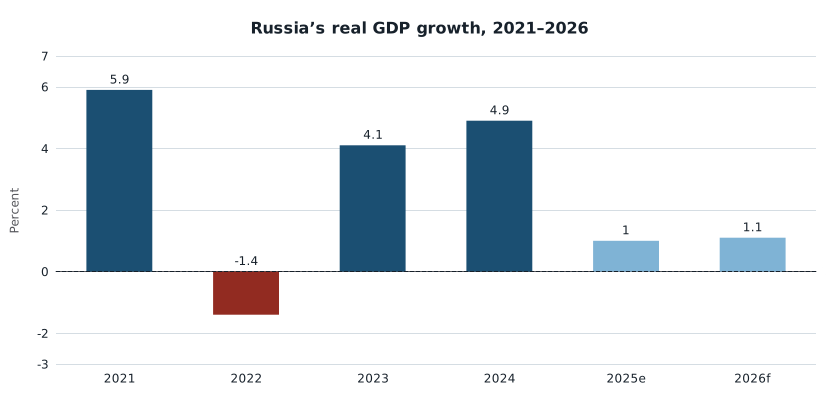
Annual percent change in real GDP, Russia. 2021–2024 are IMF World Economic Outlook historical estimates; 2025 is a WEO estimate for a completed year; 2026 is an IMF projection. Real GDP includes military production and does not split civilian from defence output. Source: IMF WEO, NGDP_RPCH. Explore the same real-GDP growth series (choose Russia in the chart).
That is a stall, not the recession Klepach described for 2026. A 1 percent pace is also close to the 1–1.5 percent “potential” he said might be all that is left. The Fund’s 2026 number is a projection, and it is an annual average: it cannot rule out a weak first half or a civilian slump hidden inside rising munitions output. What it does rule out, in these accounts, is a headline contraction.
Larger than in 2021 — unlike Ukraine
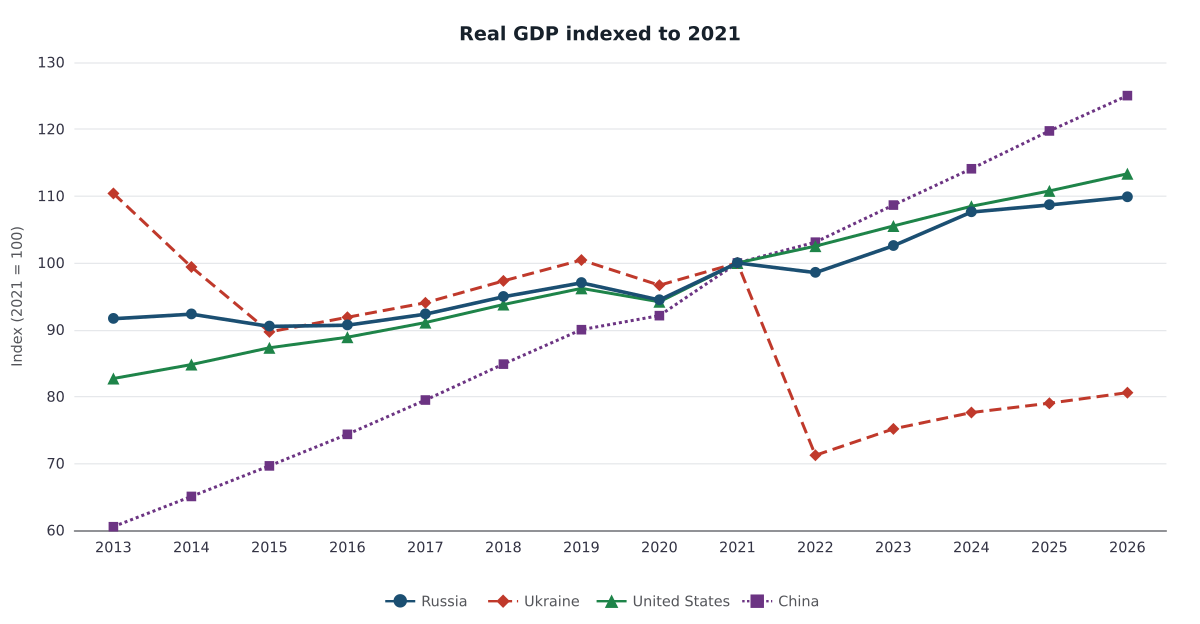
Real GDP is still higher than before the invasion. Indexed to 2021, Russia’s constant-price output is 107.6 in 2024 and 109.9 in the 2026 projection: about 10 percent larger than in 2021. The United States, on the same index, reaches 113.4. China reaches 125.0.
Ukraine does not. Its real GDP fell 28.8 percent in 2022. Even after a rebound, the 2026 projection is still 19.4 percent below 2021.
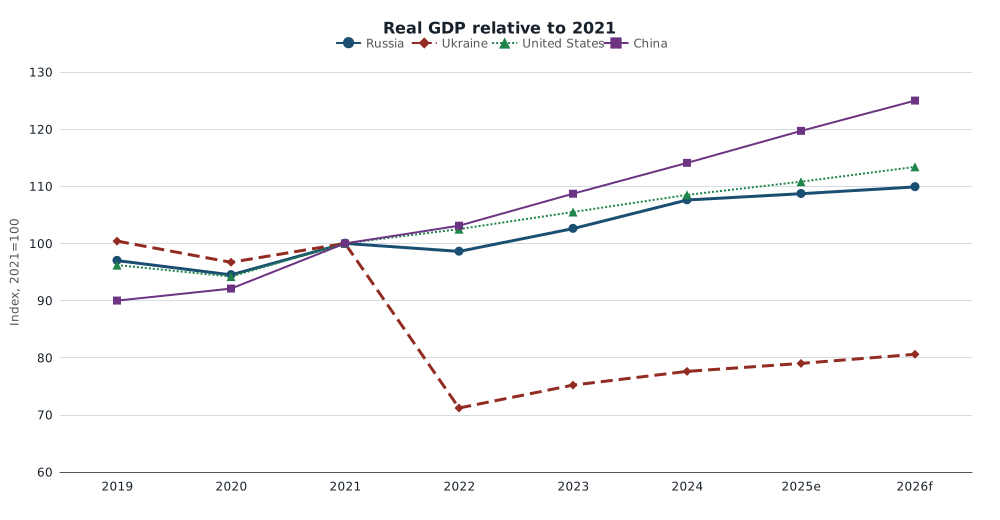
Index of real GDP in constant national currency, 2021=100. National-currency volumes are not comparable across countries except as an index. 2025 is a WEO estimate; 2026 is an IMF projection. Source: IMF WEO, NGDP_R.
Klepach’s remark that Russia is “losing” to Ukraine in some respects is not a statement about output levels. Ukraine’s growth rates in 2023–24 look respectable only because they are climbing out of a hole. The Fund’s own budget figures underline the different fiscal arithmetic: Ukraine’s general-government deficit is 17–23 percent of GDP in 2023–25, against 1.6 percent in Russia in 2024 and 3.9 percent in 2025. Survival with large-scale external financing is not the same as a larger economy.
Relative to China and the United States, the lag is real and smaller than a “defeat” slogan. From 2021 to 2026, real GDP rises 9.9 percent in Russia, 13.4 percent in the United States and 25.0 percent in China. Russia’s share of world output at purchasing-power parity slips from 3.62 percent in 2021 to 3.38 percent in 2026. China’s share rises from 18.73 to 19.88 percent over the same years; America’s edges down from 15.10 to 14.54 percent. Russia is not vanishing from the world accounts. It is not keeping pace with the two economies Klepach named.
| 2021–26 real GDP | 2026 index, 2021=100 | World PPP share, 2021 → 2026 | |
|---|---|---|---|
| Russia | +9.9% | 109.9 | 3.62% → 3.38% |
| United States | +13.4% | 113.4 | 15.10% → 14.54% |
| China | +25.0% | 125.0 | 18.73% → 19.88% |
| Ukraine | −19.4% | 80.6 | — |
Cumulative change uses each country’s constant-price GDP in national currency. PPP shares are percent of world GDP. 2026 values are IMF projections.
Heat, not joblessness
If the boom is over, the overheating is not fully gone.
Average consumer-price inflation in Russia was 13.7 percent in 2022, 8.4 percent in 2024 and 8.7 percent in 2025. The Fund sees 5.6 percent in 2026. US inflation, by the same measure, is back around 3 percent. Russian prices did not settle after the invasion spike.
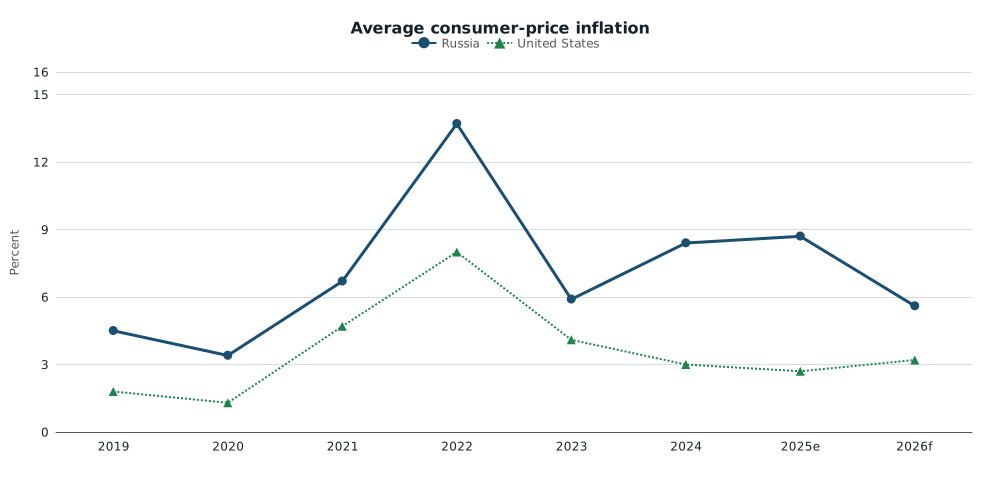
Annual average consumer-price inflation, percent. 2025 is a WEO estimate; 2026 is an IMF projection. Source: IMF WEO, PCPIPCH. Explore the same inflation series (choose Russia in the chart).
The 2022 oil-and-gas windfall faded with it. The current-account surplus peaked at 10.4 percent of GDP in 2022 and was 1.6 percent in 2025. The general-government balance moved from a 0.8 percent of GDP surplus in 2021 to deficits of 1.6 percent in 2024 and 3.9 percent in 2025. Spending rose from 34.9 percent of GDP in 2021 to 39.1 percent in 2025.
That is fiscal strain, not a debt crisis. Gross government debt is still 14.8 percent of GDP in 2024 and 19.1 percent in the 2026 projection — low by any rich-country standard. Unemployment, far from signalling a social bust, falls to 2.5 percent in 2024 and 2.2 percent in 2025. Those are labour-shortage numbers, consistent with a war economy pulling in workers, not with mass joblessness.
Klepach also said investment had fallen sharply. The IMF series on hand is investment as a share of GDP, not real investment growth. That ratio jumped from 23.0 percent in 2021 to 27.3 percent in 2023 and eases only to 25.9 percent in 2026 — still above the pre-war level. The ratio cannot confirm a collapse in capital formation; it also cannot prove that the extra investment went into factories rather than fortifications.
Real GDP per person rose faster than total output: 11.7 percent from 2021 to 2026, against 9.9 percent for GDP. Part of that gap is arithmetic. Dividing the Fund’s constant-price GDP by its constant-price GDP per capita implies a population about 2.4 million smaller in 2026 than in 2021. Emigration, war deaths and fewer births can lift output per survivor without making civilian life more abundant. The WEO does not identify those channels.
What the accounts cannot settle
None of this measures the technological lag Klepach emphasised, the damage from strikes on ports and refineries, or the quality of what Russia now produces. War GDP counts shells. It does not say whether aircraft plants or housing construction are in recession.
Households voting with their wallets sit outside these series. A Moscow Times report, citing Central Bank of Russia statistics, said households sent almost 600 billion roubles — about $7.2 billion — to foreign brokers between December 2024 and June 2026, more than in the previous seven years combined. That figure is reported, not re-estimated here. It is a reminder that a 1 percent growth rate and a 2 percent unemployment rate can coexist with people trying to get money out.
The useful reading of Klepach is therefore narrower than “Russia is losing the war.” In the IMF’s books, Russia did not get poorer in the aggregate after 2022. It got a military boom, then a crawl, with inflation still high, the oil surplus gone, and a larger — still affordable — budget deficit. It is smaller relative to China than it was in 2021, and still far larger than a shattered Ukraine. A social crisis can be announced from a state bank. It is not yet visible as an output collapse.
Sources and methods
This is a retrospective analysis. The news remarks are from 15 August 2026; the calculations use the pinned IMF WEO snapshot available at research time (10 September 2026), retrieved from the Fund’s SDMX WEO 9.0.0 feed on 10 August 2026 and recertified on 24 August 2026. Later WEO vintages can revise history.
All growth rates are annual percent changes in real GDP (NGDP_RPCH). Cross-country level comparisons use an index of each country’s own constant-price GDP (NGDP_R), base 2021=100; those volumes are not in a common currency. Inflation is average consumer prices (PCPIPCH). Fiscal figures are general government. 2013–2024 are treated as WEO historical estimates, 2025 as an estimate for a completed year, and 2026 as an IMF projection. Missing values are not treated as zero. Official source: IMF World Economic Outlook.
Research Date
The displayed date matches the related news edition. Research was completed 2026-09-10.
Related news: Daily · 2026-08-15
More Research
Brazil Is Barely Richer Per Person Than It Was In 2013
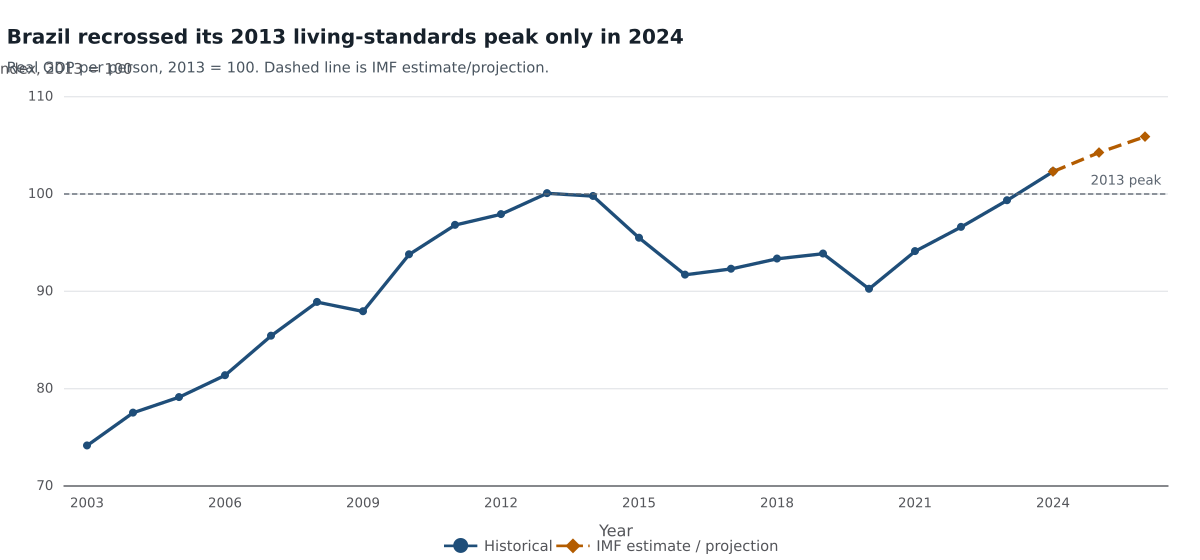
IMF accounts show Brazil recrossed 2013 real output per person only in 2024, while 2022’s inflation spike has receded.
The Surplus On Hormuz Is Not Iran’s
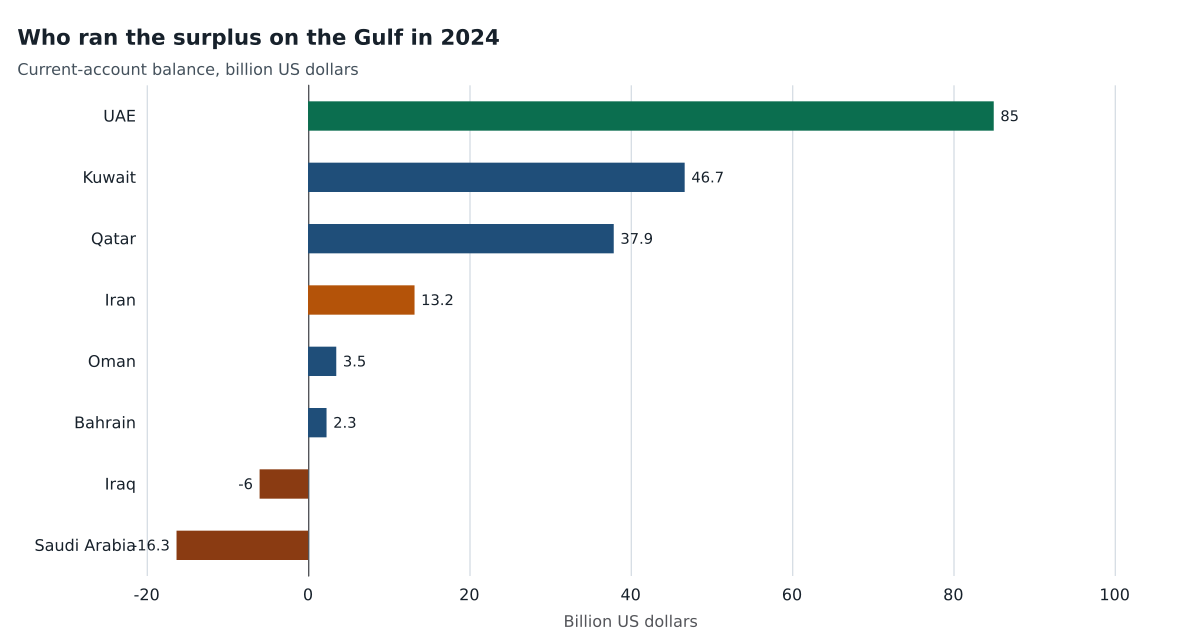
IMF current-account books for 2024 put the large Gulf surplus in the UAE, Kuwait and Qatar, not Iran — the country a Hormuz blockade is meant to squeeze.
Russia’s War Economy Grew. The Boom Is Already Fading.
IMF accounts show Russia’s real GDP above 2021 after a 2023-24 wartime boom, now slowing toward 1 percent as the EU prepares tougher sanctions.