LunarWeave
The Surplus On Hormuz Is Not Iran’s
When Washington talks about turning the Strait of Hormuz into American territory and keeping an indefinite naval blockade on Iran, the political target is Tehran. The external surplus sitting on that coast is not.
In mid-August, Donald Trump said he would “pretty soon” declare the strait a U.S. territory “after defeating Iran” — a remark whose seriousness even the reporters covering it left unclear. The backdrop was not a joke. The United States had threatened to maintain a naval blockade of Iran indefinitely as ceasefire talks stalled, and the UAE accused Iran of attacking two ADNOC tankers in the strait. U.S. officials, in separate comments, also said cheaper oil for American consumers had become a top war aim.
A blockade billed as squeezing Iran would close, or put at risk, the same bottleneck used by Iran’s neighbours. The question the IMF’s books can answer is not how many barrels transit the 33-kilometre gap — this dataset does not measure tanker flows — but who on that coast is actually running a large external surplus.
Iran’s surplus is small. The UAE’s is not.
In 2024, the latest year treated here as largely historical in the IMF World Economic Outlook vintage, Iran’s current-account surplus was $13.2 billion. The United Arab Emirates ran $85.0 billion — about 6.4 times as much. Select the UAE or Iran in the chart on that page; the live figures match this snapshot.
That is not because Iran’s economy is tiny next to the UAE’s. Iran’s dollar GDP in 2024 was $417 billion; the UAE’s was $552 billion. The gap is in the external balance, not in headline size. As a share of the economy, Iran’s surplus was 3.2% of GDP. The UAE’s was 15.4%.
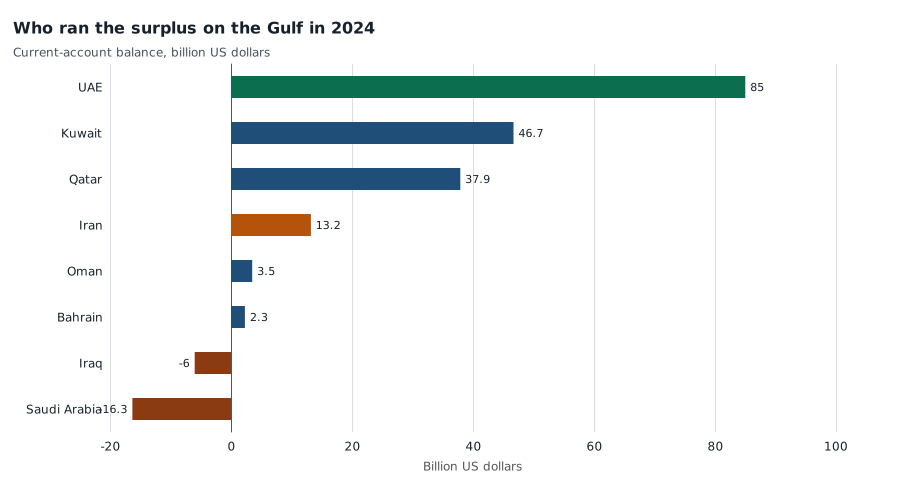
Current-account balance in 2024, billion US dollars. IMF World Economic Outlook, national current accounts (not oil-export receipts or tanker volumes). The current account includes goods, services and income, so the UAE figure is not a count of barrels through Hormuz. Iraq and Saudi Arabia recorded deficits. Source: IMF WEO series BCA.
Kuwait and Qatar, which also ship through Hormuz, ran surpluses of $46.7 billion and $37.9 billion. Together with the UAE they accounted for $169.6 billion of the $188.5 billion in combined 2024 surpluses among the eight Gulf oil exporters compared here (Iran, Iraq, Saudi Arabia, Kuwait, Qatar, the UAE, Oman and Bahrain). Iran’s $13.2 billion was 7.0% of that surplus pool. Oman and Bahrain were smaller still. Iraq was already $6.0 billion in deficit.
Saudi Arabia is the giant on the map and a deficit on the external accounts. Its 2024 GDP was $1.25 trillion — more than Iran and the UAE combined — and its current account was $16.3 billion in the red, or −1.3% of GDP. A Hormuz shutdown would still be a Saudi oil-export problem. It would not be closing a Saudi surplus, because there was not one in 2024.
As a share of national income, Kuwait is the extreme case, not the UAE.
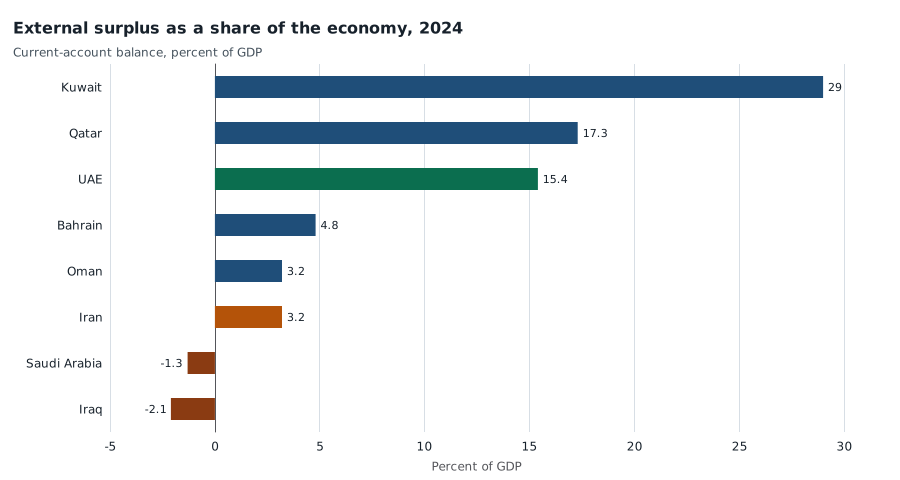
Current-account balance in 2024, percent of GDP. Kuwait’s surplus was 29.0% of GDP, Qatar 17.3% and the UAE 15.4%; Iran’s was 3.2%. Saudi Arabia and Iraq were in deficit. Choose each country in the chart selector. A current-account ratio is not an oil-export share. Source: IMF WEO series BCA_NGDPD.
The current account is the right measure for “who has an external surplus” and the wrong measure for “who loads oil at Kharg Island.” It nets goods, services and income. The UAE’s number includes oil, but also a trade-and-services hub that Iran does not have. Kuwait’s 29% of GDP is closer to a classic petrostate surplus; the UAE’s 15% is a mixed external machine. None of these figures is a barrel count through Hormuz, and a pipeline to Fujairah already lets some UAE crude skip the strait. What the books do show is that the large surplus economies on that waterway are the small Gulf monarchies, not the country being blockaded.
The Fund’s 2026 figures already have Iran in deficit
The IMF’s 2025 and 2026 values in this vintage are Fund estimates and current-year figures, not audited outturns. They still change the picture. Iran’s surplus shrinks to $2.4 billion in 2025 (0.6% of GDP) and turns into a $5.4 billion deficit in 2026 (−1.8% of GDP). The UAE remains in surplus: $87.2 billion in 2025 (15.3% of GDP) and $70.9 billion in 2026 (11.4%). Saudi Arabia’s deficit widens to $37.7 billion in 2025 before easing to $22.3 billion in the 2026 figure.
A policy that treats Hormuz as a pressure valve on Iran is, on these accounts, squeezing a balance that is already slipping into the red — while the neighbours that use the same exit still run double-digit surpluses as a share of GDP.
| Economy, 2024 | Current account | % of GDP | GDP |
|---|---|---|---|
| United Arab Emirates | +$85.0 bn | +15.4% | $552 bn |
| Kuwait | +$46.7 bn | +29.0% | $161 bn |
| Qatar | +$37.9 bn | +17.3% | $219 bn |
| Iran | +$13.2 bn | +3.2% | $417 bn |
| Oman | +$3.5 bn | +3.2% | $107 bn |
| Bahrain | +$2.3 bn | +4.8% | $47 bn |
| Iraq | −$6.0 bn | −2.1% | $287 bn |
| Saudi Arabia | −$16.3 bn | −1.3% | $1,254 bn |
Annual oil is up. It is not a 2022-style year.
The other half of the American pitch is cheaper oil. In the same WEO vintage, annual Brent averaged $68.32 a barrel in 2025. The 2026 figure is $80.19 — $12 above 2025, and still $19 below 2022’s $99.00. The Fund’s average petroleum spot price tells the same story: $67.74 in 2025, $82.22 in 2026, against $96.36 in 2022. Those 2026 points are IMF current-year figures, not a quote from any August trading day. They cannot confirm or refute a one-week spike. They do show that, as an annual average in this vintage, 2026 oil is a rebound from 2025, not a repeat of the 2022 shock, and it remains below the 2011–13 averages above $108.
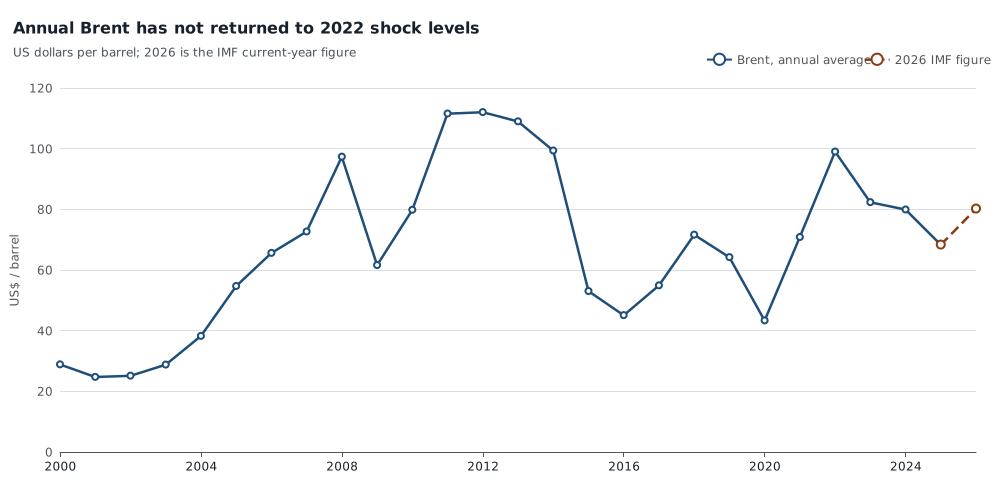
IMF World Economic Outlook annual Brent crude price, US dollars per barrel, 2000–2026. The 2026 point is the Fund’s current-year figure in this vintage ($80.19), not a daily market quote; 2022 averaged $99.00. Geography G001 is the WEO world commodity-price series. Source: IMF WEO POILBRE.
That matters for the politics. A strait fight that raised oil for a few weeks can still be a consumer shock. It is not, in the IMF’s annual numbers, the kind of full-year price regime that flooded Gulf current accounts in 2022, when Saudi Arabia’s surplus was 11.7% of GDP and the UAE’s 13.0%. By 2024 the Saudi surplus was gone. The UAE’s was larger than in 2022. Iran never had a 2022-style windfall on these books: its surplus that year was 3.5% of GDP.
What this does — and does not — say
A blockade can still hurt Iran. Sanctions, insurance, and the threat to tankers operate on volumes and discounts that never appear in a current-account ratio. The Fund already has Iranian real GDP falling 1.5% in 2025 and 6.1% in 2026; those are estimates, and they are a different question from who holds the surplus.
What the accounts do say is simpler. If the argument is that seizing or sealing Hormuz punishes the petrostate with the fat external surplus, the 2024 books point to Abu Dhabi, Kuwait City and Doha, not Tehran. Iran’s surplus was already small. In the IMF’s 2026 figures it is gone. The monarchies that share the waterway still have one.
Sources and methods
This is retrospective research, written on 10 September 2026, about reporting from 14 August 2026. It uses the IMF World Economic Outlook snapshot pinned for this project (source run 10 August 2026; normalized 24 August 2026), which can include later revisions than were public on digest day. Series are annual. Values for 2025 and 2026 are IMF estimates or current-year figures, not daily market prices and not final outturns. Geography G001 is the WEO world commodity-price geography used for Brent (POILBRE) and the average petroleum spot price (POILAPSP). Country figures use ISO codes IRN, ARE, SAU, IRQ, KWT, QAT, OMN and BHR. Current-account dollar totals were checked against current-account ratios times GDP; differences were rounding dust. Official definitions: IMF World Economic Outlook. Browser layout of the charts was not separately tested beyond SVG rendering.
Research Date
The displayed date matches the related news edition. Research was completed 2026-09-10.
Related news: Daily · 2026-08-14
More Research
Russia Is Larger Than Before The Invasion. The War Boom Is Over.
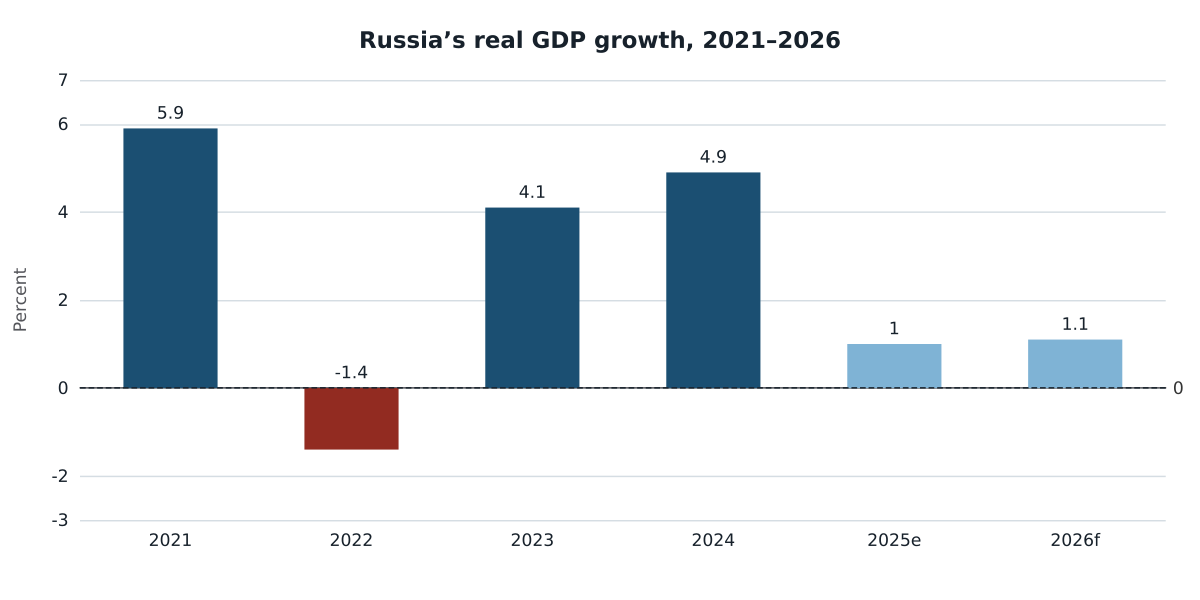
IMF accounts show Russia’s 2023–24 war boom slowing to about 1 percent growth, not an output collapse.
The Afghan Economy’s Rebound Never Reached Its People
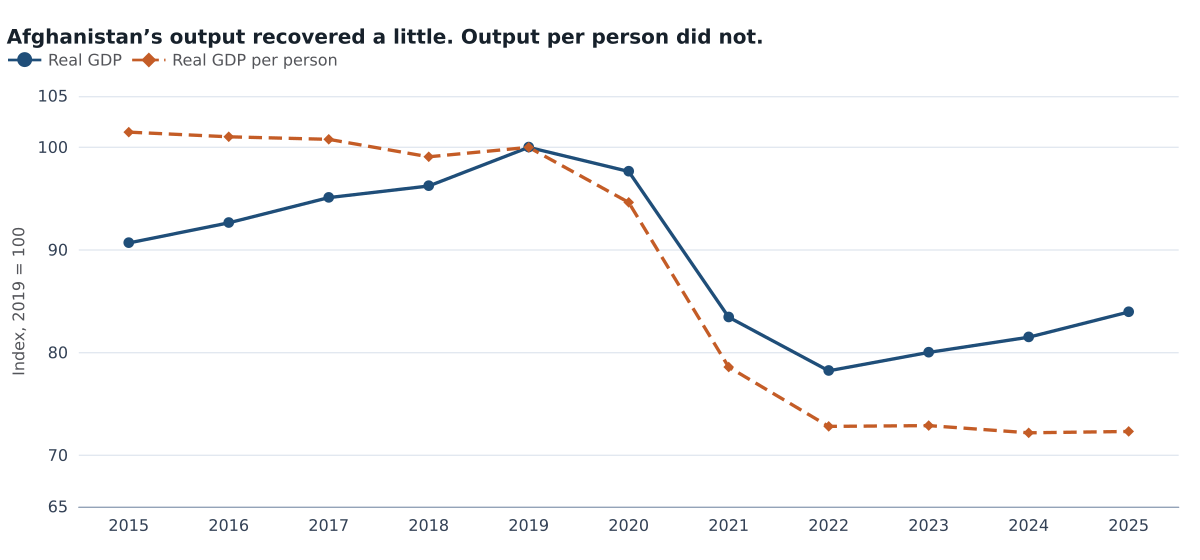
IMF accounts show Afghanistan’s real output per person still about 28 percent below 2019, five years after the Taliban takeover.
Brazil Is Barely Richer Per Person Than It Was In 2013
IMF accounts show Brazil recrossed 2013 real output per person only in 2024, while 2022’s inflation spike has receded.