LunarWeave
Qatar’s Worst Slump In A Generation Still Leaves An 11 Percent Surplus
Qatar is a small country that sells a large share of the world’s seaborne gas. In late August, Izvestia reported, citing Reuters and unnamed cargo trackers, that liquefied-natural-gas exports had fallen 96 percent since February 2026, when the US-Israel campaign against Iran began. A companion Reuters headline described Qatari gas as stranded for six months, with US sales rising and European markets sliding.
If that flow rate were the whole of the national accounts, Doha would be looking at something closer to a shutdown than a recession. The IMF World Economic Outlook already on the books says something more specific, and in one respect more severe: 2026 is Qatar’s worst year of constant-price GDP in the 2000–2031 window of this snapshot, deeper than the Covid contraction. It does not say that exports vanish, and it does not say that the external surplus disappears.
A deeper hit than Covid
In this WEO vintage, Qatar’s real GDP falls 8.6 percent in 2026. That is the only year in the 32-year span from 2000 through 2031 in which output contracts by more than 4 percent. The previous low was 2020, at −3.6 percent. The 2026 reading is 5.1 percentage points deeper, and more than twice as large.
The 2000s boom is the other side of the same chart. Real growth ran at 19.2 percent in 2004 and 28.1 percent in 2006, then stayed in double digits through 2011. After 2017, when output dipped 1.5 percent, the economy never again posted a year like that expansion. Even so, 2026 is not a mild downshift. Chaining the Fund’s own growth rates, real GDP in 2026 is 8.6 percent below 2025 and 6.1 percent below 2024.
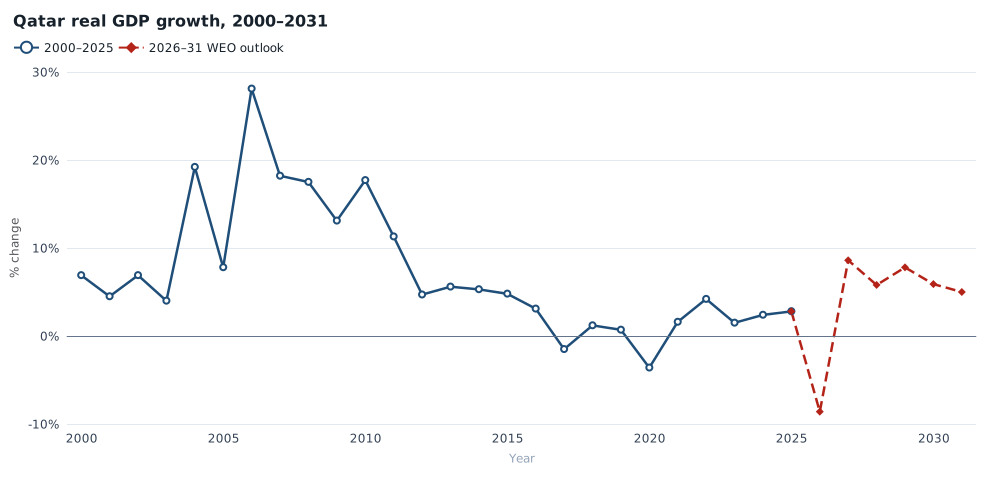
Annual percent change in Qatar’s constant-price GDP. The solid line is 2000–2025; the dashed line is the 2026–31 World Economic Outlook in the same snapshot. 2025 may still be an estimate. Source: IMF WEO, series NGDP_RPCH. This is not LNG cargo data.
Among energy exporters in the same 2026 vintage, Qatar is the weakest. Iran’s real GDP falls 6.1 percent and Iraq’s 6.8 percent. Kuwait is barely negative, at −0.6 percent. Norway, the United States, Saudi Arabia and the United Arab Emirates remain in positive territory. The clustering of contractions in Qatar, Iran and Iraq is consistent with a war-year outlook. It is not proof that every Gulf producer is in the same shock, and it is not a measure of LNG cargoes.
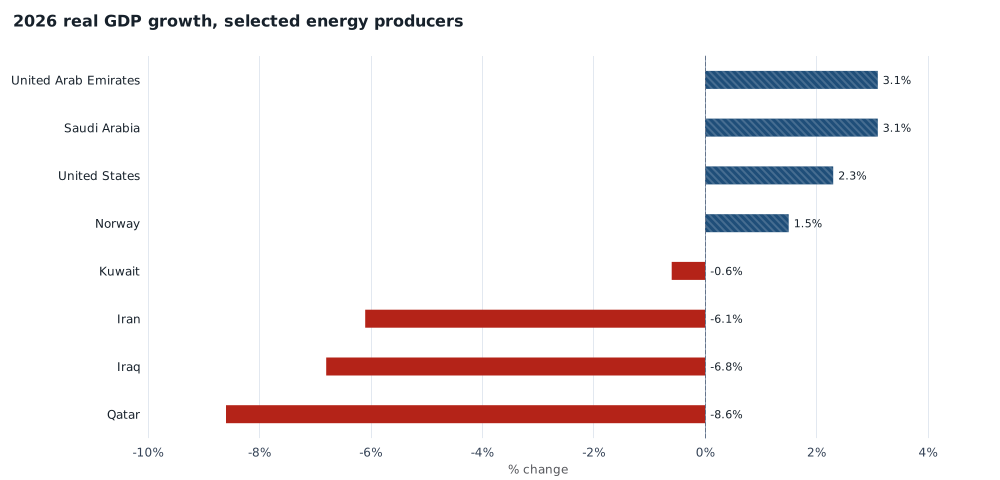
IMF WEO constant-price GDP growth for 2026, selected energy-exporting economies. Outlook figures, not realized outcomes. Negative bars are solid; positive bars use a hatch overlay. Source: IMF WEO NGDP_RPCH. Choose Qatar, or any other country, in the series chart.
| Economy | 2026 real GDP, % change |
|---|---|
| Qatar | −8.6 |
| Iraq | −6.8 |
| Iran | −6.1 |
| Kuwait | −0.6 |
| Norway | 1.5 |
| United States | 2.3 |
| Saudi Arabia | 3.1 |
| United Arab Emirates | 3.1 |
The dollar picture is milder because it mixes prices, exchange rates and real activity. Current-dollar GDP edges down from $221.2 billion in 2025 to $217.4 billion in 2026. GDP per capita is still about $68,100 for a population the Fund puts at 3.19 million. Inflation averages 3.9 percent. None of that makes an 8.6 percent real contraction small. It does mean the Fund is not writing Qatar down as a collapsed dollar economy.
A 23 percent export shock is not a 96 percent one
The reported 96 percent drop is a claim about LNG cargoes over a stretch of 2026, not a national-accounts identity. The WEO series that comes closest is the volume of goods exports, which the Fund has falling 22.9 percent in 2026. The broader volume of goods and services exports falls 20.1 percent.
That is a serious trade shock. It is not an annual wipeout of exports, and it cannot confirm or refute the Reuters cargo figure. LNG is only part of goods exports; a six-month halt at a 96 percent lower flow rate would not have to show up as −96 percent in a calendar-year volume index; and the WEO number is an outlook, not a customs count. The honest reading is narrower: if the Fund’s 2026 accounts already include a war-year hit, they still describe an economy that exports a large fraction of what it exported the year before.
The same vintage then bakes in a rebound. Goods-export volumes rise 16.0 percent in 2027, and real GDP rises 8.6 percent, enough to put 2027 output about 2 percent above 2024. That V-shape is a scenario, not a fact. If cargoes remain stranded well into 2027, it is the part of the outlook most exposed to later revision.
The surplus shrinks. It does not vanish.
Qatar’s current-account surplus is 11.0 percent of GDP in 2026, or $24.0 billion. That is down from 17.3 percent ($37.9 billion) in 2024 and 14.5 percent ($32.1 billion) in 2025. It is still a large surplus. In this 2000–2031 window, the current account is in deficit only in 2016 and 2020. The Fund does not put 2026 in that pair.
The budget is the account that actually flips. General-government net lending goes from a 10.4 percent-of-GDP surplus in 2022 to a 0.7 percent surplus in 2024, a 1.0 percent deficit in 2025 and a 3.4 percent deficit in 2026. Revenue slips from 34.7 percent of GDP in 2022 to 25.5 percent in 2026, while spending is 29.0 percent. Gross debt stays moderate, at 43.3 percent of GDP. A hydrocarbon state can take a historic output hit, keep earning more abroad than it spends, and still need to borrow a little at home.
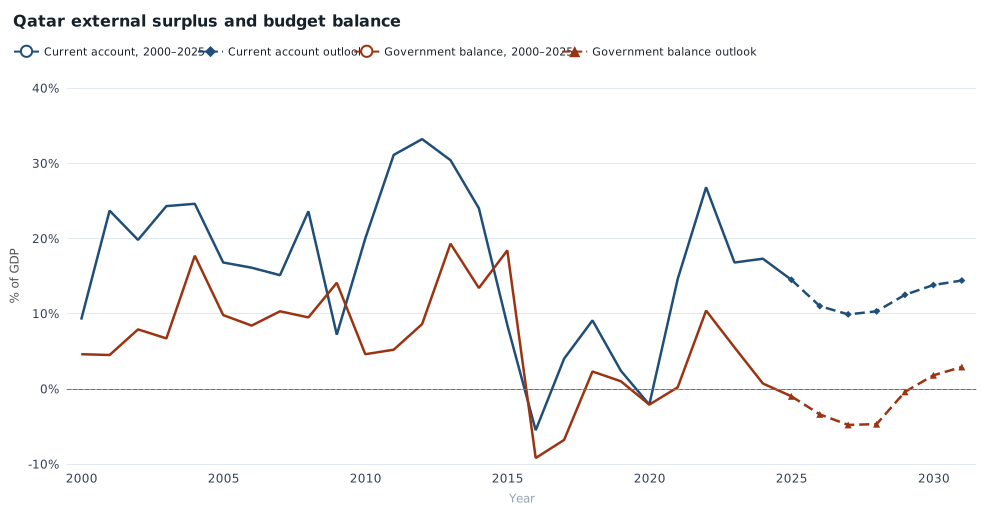
Current-account balance and general-government net lending/borrowing, percent of GDP, Qatar, 2000–2031. Dashed segments are 2026–31 WEO outlook. A current-account surplus is not LNG export revenue. Sources: IMF WEO BCA_NGDPD and GGXCNL_NGDP.
In 2026 the Fund also has the UAE still running an 11.4 percent current-account surplus and Norway 14.3 percent. Saudi Arabia is slightly in deficit. Qatar’s 11.0 percent is the surplus of a rich exporter under stress, not an external crisis.
What the outlook cannot settle
Three things do not follow. First, these IMF series do not measure LNG. They cannot verify the 96 percent cargo claim, and they cannot show whether US sellers gained the lost Qatari volumes. Second, 2026–31 in this snapshot are outlook figures; 2025 may still be an estimate. They are not realized national accounts. Third, a current-account surplus is not a welfare statement. It does not say who inside Qatar absorbs the 8.6 percent drop in real output.
What the figures do settle is the shape of the official 2026 picture. The Fund already has Qatar in a worse slump than Covid, worse than Iran or Iraq in this vintage, with goods exports down by about a fifth. It still has an 11 percent external surplus and a rebound on the books for 2027. That is a historic recession in a solvent-looking energy state — not the disappearance of the export machine the cargo headlines describe.
Methods and sources
This article is retrospective research, written on 10 September 2026, about reporting from 26 August 2026. It uses the pinned IMF World Economic Outlook snapshot ingested from the IMF SDMX API on 10 August 2026 and certified on 24 August 2026, not an as-of reconstruction of what was knowable on 26 August 2026. Later data may have been unavailable then.
All growth, balance and export-volume figures are annual IMF WEO series for Qatar unless a comparison country is named. Percentages in the prose are rounded to one decimal place from the saved extracts; dollar totals are converted from source US dollars to billions in the analysis script. Constant-price comparisons of 2026 with 2024 and 2025 chain the WEO growth rates; they are not a separate output-level series. Empty extracts were treated as missing, not zero: the goods-and-services export value series returned no Qatar observations and was not used.
The 96 percent LNG figure is a reported claim from Izvestia’s 26 August 2026 dispatch citing Reuters. It is not a catalogue observation. MacroVedia series pages linked above are the same IMF measures; readers need to select Qatar in the chart. Cited 2020, 2024, 2025 and 2026 points matched the live pages on 10 September 2026. Browser and mobile layout were not separately tested beyond SVG rendering.
Research Date
The displayed date matches the related news edition. Research was completed 2026-09-10.
Related news: Daily · 2026-08-26
More Research
Nepal’s Electricity Now Hangs On Himalayan Rivers
Nepal generates 98.9 percent of its electricity from hydropower and more than tripled on-grid hydro capacity from 2019 to 2025, leaving almost no domestic thermal backup after a Himalayan gl
China’s Population Peaked In 2021. India’s Rise Is Still Much Larger.
IMF headcount shows China peaked in 2021; India’s three-year gain is still about 8.5 times China’s loss.
Japan’s Inflation Is Now Higher Than America’s
IMF average CPI inflation was above 2% in the United States for five calendar years through 2025. Japan has now had four such years, and in 2025 Japanese inflation ran higher than America’s.