LunarWeave
Japan’s Inflation Is Now Higher Than America’s
When Federal Reserve officials gathered at Jackson Hole in late August, they described U.S. inflation as unfinished business. The Cleveland Fed president told CNBC that prices had run above target for more than five years and that “now is the time to act,” Dong-a Ilbo reported. Warsh of the Fed, in his symposium debut, said inflation was not yet under control and left the door open to further rate rises, according to 20 minutos.
The same week, Japan spent a record ¥15.4 trillion buying yen after the dollar neared ¥164, including rare coordinated intervention with the United States, Japan’s finance ministry said via Jiji Press. That pairing is easy to misread: America fighting inflation, Japan fighting the opposite. On the comparable consumer-price measure the IMF publishes for both countries, the opposite is no longer true.
Five calendar years above 2%
The Fund’s average annual consumer-price inflation series — not the personal-consumption-expenditures index the Fed targets — shows U.S. prices rising 4.7% in 2021, 8.0% in 2022, 4.1% in 2023, 3.0% in 2024 and 2.7% in 2025. Every one of those years is above the 2% benchmark the Fed, the Bank of Japan, the ECB, the Bank of England and the Bank of Canada all use. The two years before the spike were not: 1.8% in 2019 and 1.3% in 2020. The current run starts in 2021.
That is five completed calendar years, not a proof of any official’s “more than five years” claim, which would need monthly data this catalogue does not carry. It is still a long stretch. The 2022 peak of 8.0% has faded by 5.3 percentage points, so the emergency of 2022 is over. The last mile is not.
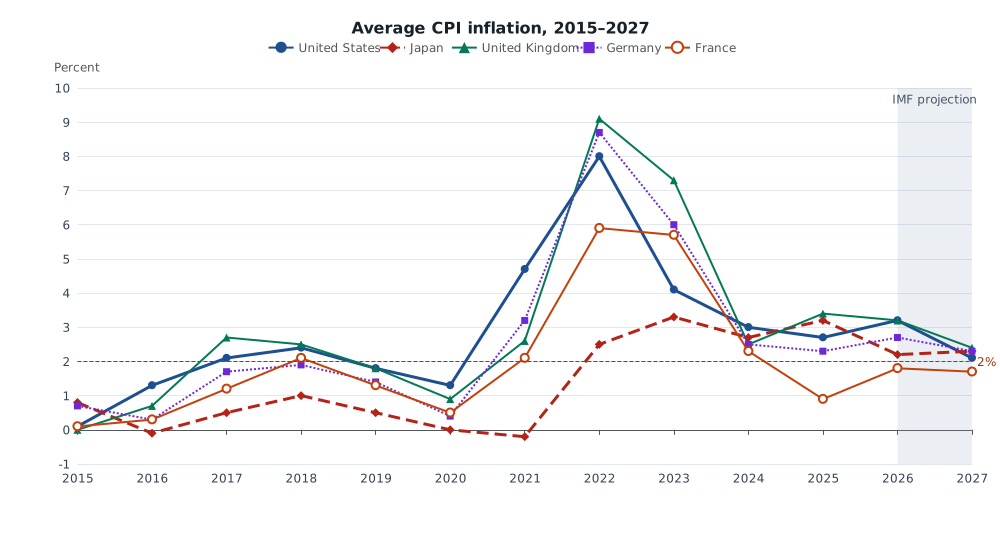
IMF World Economic Outlook, average annual consumer-price inflation (percent). 2015–2025 are the historical block in this snapshot; 2026–2027 (shaded) are IMF projections. The dashed line is 2%. The Fed’s operational target is PCE inflation, not this CPI measure. Source: IMF WEO.
Japan has already switched sides
Japan spent a generation on the other side of that line. Consumer prices fell in 15 of the 27 years from 1995 through 2021, including 2020 and 2021. Apart from 2014 — the year of a consumption-tax increase — Japan did not record a calendar-year average above 2% at any point from 2000 through 2021.
Then the line broke. Average inflation was 2.5% in 2022, 3.3% in 2023, 2.7% in 2024 and 3.2% in 2025. That is four straight years above 2%, and in 2025 Japanese inflation ran 0.4 percentage points above the United States. The IMF’s 2026 projection still has Japan at 2.2%, not a return to falling prices.
The yen intervention is therefore a currency story sitting on top of above-target inflation, not a revival of deflation. A weak yen can itself feed import prices; this dataset cannot separate that channel from domestic demand, wages or energy. What it can say is that Japan is no longer the G7 member whose consumer prices refuse to rise.
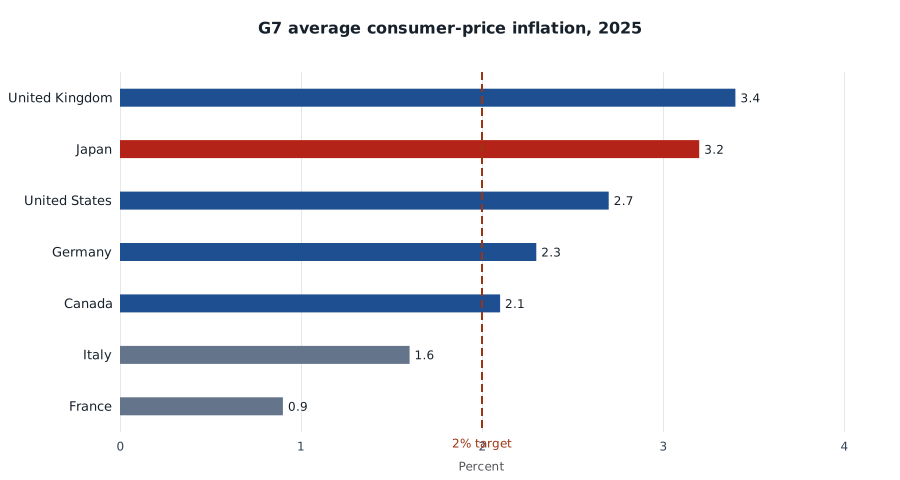
IMF average annual consumer-price inflation, percent, calendar year 2025. Darker bars are above 2%; grey bars are at or below 2%. Japan is in red. The Fed target is PCE, not CPI. Source: IMF WEO.
The G7 has already split
The United States is not unique, and it is not the hottest. In 2025 the United Kingdom’s average was 3.4%, Japan’s 3.2%, the United States 2.7%, Germany 2.3% and Canada 2.1%. France, at 0.9%, and Italy, at 1.6%, were already back at or below 2%.
That split matters for the Jackson Hole argument. If “above target for years” were a universal rich-world condition, a 2.7% U.S. print would look like the club average. It is not. Two large euro-area economies have already undershot on this measure; Britain and Japan have not. Persistence is a G7 majority, not a G7 rule.
| Country | 2021 | 2022 | 2023 | 2024 | 2025 | 2026 proj. |
|---|---|---|---|---|---|---|
| United Kingdom | 2.6 | 9.1 | 7.3 | 2.5 | 3.4 | 3.2 |
| Japan | −0.2 | 2.5 | 3.3 | 2.7 | 3.2 | 2.2 |
| United States | 4.7 | 8.0 | 4.1 | 3.0 | 2.7 | 3.2 |
| Germany | 3.2 | 8.7 | 6.0 | 2.5 | 2.3 | 2.7 |
| Canada | 3.4 | 6.8 | 3.9 | 2.4 | 2.1 | 2.5 |
| Italy | 2.0 | 8.7 | 5.9 | 1.1 | 1.6 | 2.6 |
| France | 2.1 | 5.9 | 5.7 | 2.3 | 0.9 | 1.8 |
IMF WEO average consumer-price inflation, percent. 2026 is a projection. Figures rounded to one decimal place. Italy’s 2021 average is 1.95, which rounds to 2.0 in the table but is not above the unrounded 2% threshold used in the text.
The Fund does not see the U.S. glide path finishing this year
Officials who say inflation is “not yet under control” are not fighting last year’s peak. They are looking through a 2025 print that is still above 2% to a 2026 IMF projection of 3.2% — 0.5 percentage points higher than 2025. Germany, Italy and Canada are also projected up. Japan and the United Kingdom are projected down, but both remain above 2%. Only France stays below.
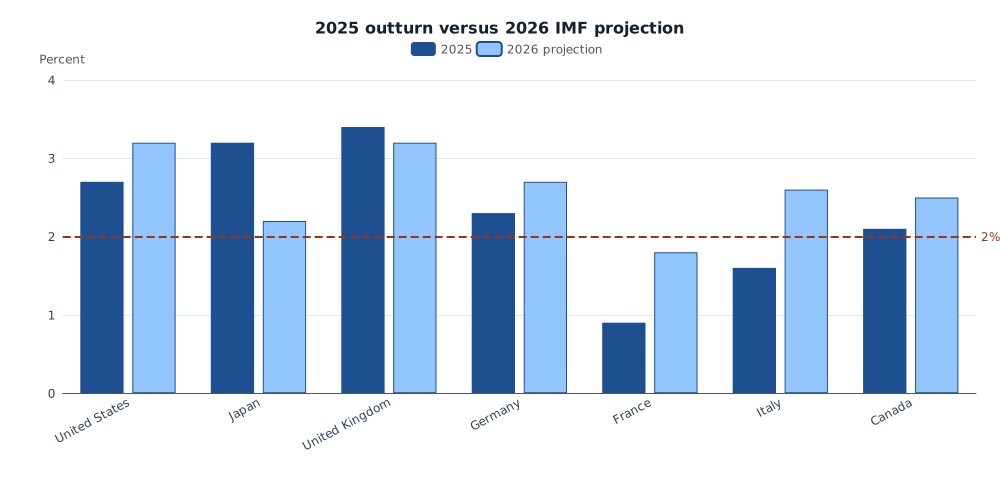
2025 is the latest completed calendar year in this snapshot; 2026 is an IMF projection, not an outturn. Dashed line: 2% benchmark. Source: IMF WEO.
Those 2026 figures are staff projections, not data. They can move with oil, the dollar, or a later WEO vintage. They do, however, explain why a 2.7% U.S. average in 2025 did not end the argument at Jackson Hole: on the Fund’s books the next year is not a return to target.
What this does not settle
The Federal Reserve targets 2% PCE inflation, which usually runs a little below CPI. A 2.7% CPI average in 2025 could sit closer to target on the Fed’s preferred index; this article cannot check that. Annual averages also hide months that dipped below 2% inside a year that still printed hot. None of these figures measure the yen, intervention volumes, or whether another rate rise would be the right instrument.
They do settle the framing. America has spent five calendar years with average CPI inflation above 2%, and the IMF’s 2026 projection ticks back up. Japan is not the deflation foil in that story. In 2025 its consumer prices rose faster than America’s.
Methods and sources
This is retrospective research completed on 10 September 2026, using a pinned IMF World Economic Outlook snapshot created on 24 August 2026 — after the 28 August 2026 news day. Later releases were not available to officials speaking at Jackson Hole. The measure is IMF series PCPIPCH, “Inflation, average consumer prices (% change).” Calendar years 2026–2031 in the extract are IMF projections or current-year estimates; 1980–2025 are treated here as the WEO historical block, though 2025 may still have been a near-final estimate in the Fund’s own vintage. Charts were rendered to SVG; they have not been separately tested in a browser or on a phone. Official source: IMF World Economic Outlook.
Research Date
The displayed date matches the related news edition. Research was completed 2026-09-10.
Related news: Daily · 2026-08-28
More Research
A Tenth Of Nepal’s Economy, And Almost Every Kilowatt
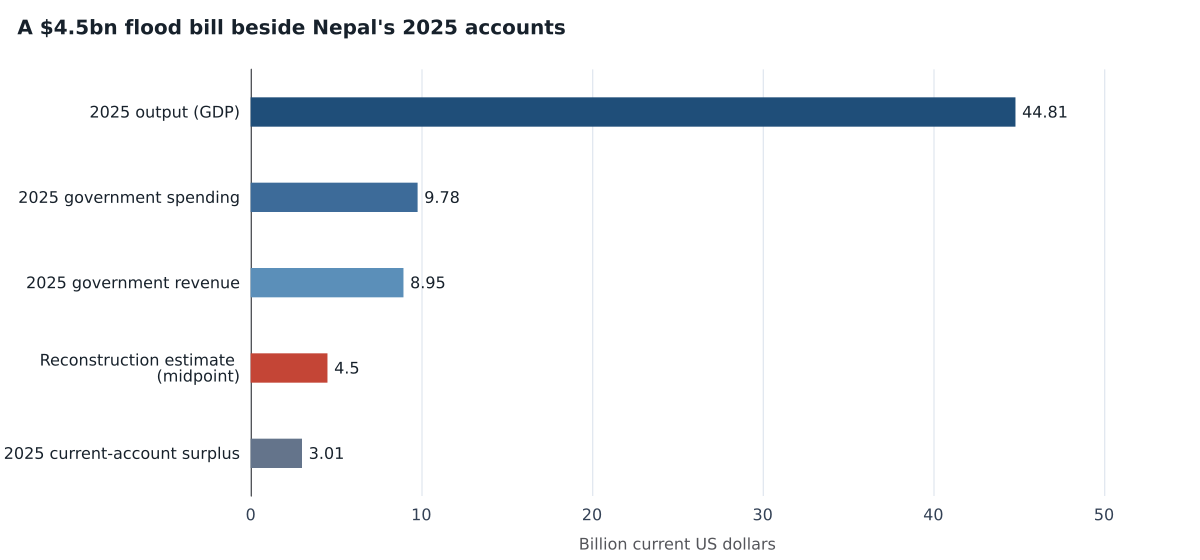
Nepal’s $4–5 billion glacier-flood reconstruction estimate is a tenth of 2025 output and about half a year’s public revenue, on a grid that already gets 99 percent of its electricity from hy
Nepal’s Electricity Now Hangs On Himalayan Rivers
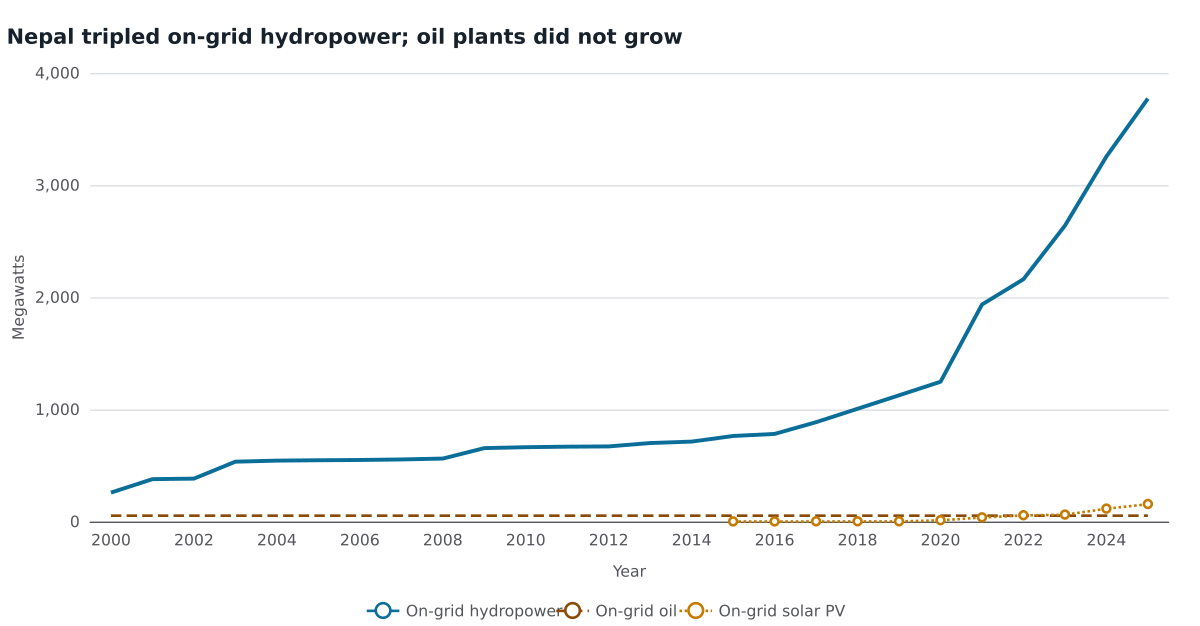
Nepal generates 98.9 percent of its electricity from hydropower and more than tripled on-grid hydro capacity from 2019 to 2025, leaving almost no domestic thermal backup after a Himalayan gl
Iceland Voted No Already Richer Than Germany — With Inflation Still The Outlier
Iceland’s 2026 EU-talks referendum was not a poor-applicant vote: IMF accounts put 2024 GDP per capita above Germany, while inflation remained the highest among European peers.