LunarWeave
Iceland Voted No Already Richer Than Germany — With Inflation Still The Outlier
Icelanders have refused to reopen talks on joining the European Union. Public broadcaster RUV’s count, reported by the Guardian, put the no side at 52.5 percent with only a handful of ballots left. Kyiv Post, also citing RUV, said the no campaign argued that membership would put the island’s sovereignty and fishing waters at risk, against a yes campaign that said joining would ease high interest rates and strengthen security. Prime Minister Kristrun Frostadottir called the result the end of EU speculation.
The slogans make the vote sound like a choice between a struggling periphery and a richer continental club. The IMF’s World Economic Outlook accounts say otherwise. In 2024, the latest completed year in this vintage, Iceland’s GDP per capita at purchasing-power parity was about $78,600 in current international dollars — 9.5 percent above Germany, 23 percent above France and 25 percent above the United Kingdom. What Iceland has not imported is Europe’s disinflation. Average consumer prices there rose 5.9 percent in 2024, more than double Germany’s 2.5 percent and far above Denmark’s 1.3 percent. That is the price-pressure backdrop to the yes campaign’s interest-rate argument. It is not a measure of the policy rate itself, and it does not prove that EU membership would have closed the gap.
Already in the rich-country cluster
The comparison that matters for an accession debate is not whether Iceland is the richest country in Europe. It is whether voters were being asked to join a club that is, in living-standards terms, richer than they are.
They were not. Among a 15-country European peer group — Nordics, large EU members, the United Kingdom and Switzerland — Iceland ranked fifth in 2024 on the IMF’s GDP per capita at purchasing-power parity. Norway, Switzerland, Denmark and the Netherlands sat above it. Germany, Sweden, France, Britain, Italy, Spain and Poland sat below. Ireland and Luxembourg are left out of that ranking because their GDP per capita is inflated by multinational profit booking; that is a measurement problem, not a reason to slide Iceland down the list.
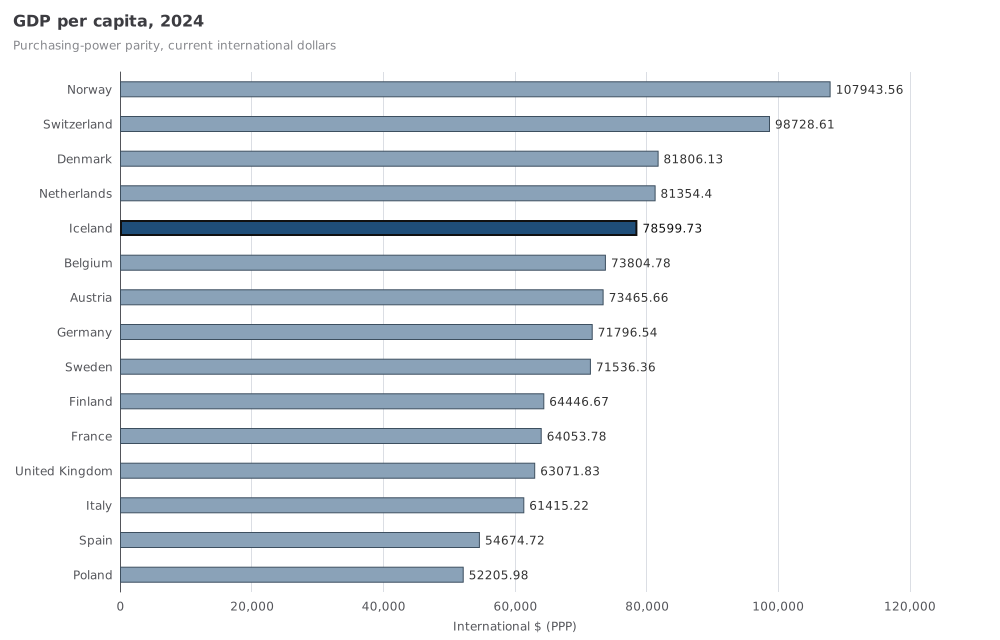
IMF World Economic Outlook GDP per capita in current international dollars (purchasing-power parity), 2024. Iceland is highlighted. Ireland and Luxembourg omitted. Source: IMF WEO series PPPPC. Choose Iceland or Germany in the MacroVedia PPP per-capita chart to inspect the same series.
PPP GDP per capita is an economy-wide average, not a typical household’s purchasing power, and it does not say how much of Iceland’s income comes from fish. It does answer a narrower question: on the IMF’s comparable living-standards yardstick, this was not a poor island asking for market access.
A constant-price version of the same PPP accounts shows that Iceland is not merely coasting on a pre-crash peak. Output per person fell sharply in 2009, then recovered. By 2024 it was about 18 percent above the 2009 trough and about 6 percent above 2007. Germany’s constant-PPP per-capita rise from 2007 was larger, because Germany’s crash was milder. Even so, Iceland remained above Germany on that constant-price measure too.
The latest year was not strong. Real GDP contracted 1.3 percent in 2024, a weaker print than Germany’s 0.5 percent decline. Constant-PPP output per person also slipped from 2023. That is a real dip. It is not a labour-market crisis: unemployment averaged 3.4 percent, the same as Germany’s, and far below Iceland’s 8.0 percent in 2009.
The open economic argument is inflation
If the income ranking undercuts a poverty story, average consumer-price inflation is where the yes campaign’s economic case still has evidence.
Iceland’s 2024 inflation was the highest in the same 15-country group. Belgium was next at 4.3 percent. Germany was at 2.5 percent; Denmark, which is in the EU but not the euro, was at 1.3 percent. The 2022 energy spike hit Iceland too — 8.3 percent, in line with Germany — but Iceland did not come back down with its neighbours.
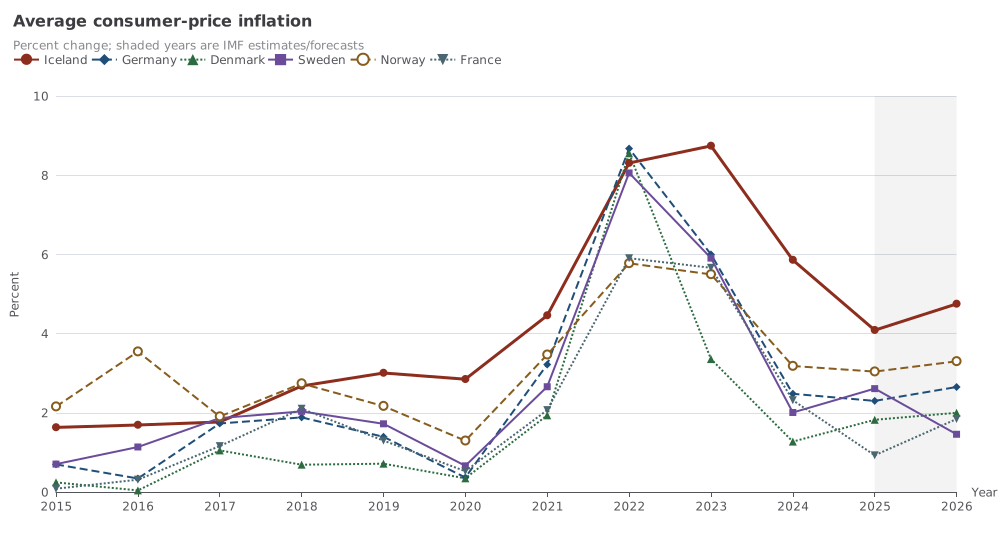
Average consumer-price inflation, percent change. 2025 is an IMF staff estimate and 2026 a forecast in this vintage; earlier years are treated as completed. Inflation is not a policy interest rate. Source: IMF WEO series PCPIPCH.
The IMF’s 2025 estimate still has Iceland at 4.1 percent, with a 2026 forecast of 4.8 percent — still the highest in this peer set, and still well above Germany’s 2.3 and 2.7 percent. Those later years are staff numbers, not realized annual outcomes. They are useful only as the Fund’s own view that Iceland’s inflation problem is not assumed to vanish in a year.
None of this identifies the cause. Iceland has its own currency, and the WEO does not split inflation into housing, import prices or wages, or isolate fish. The data also do not include central-bank policy rates, so they cannot test the yes campaign’s interest-rate claim directly. They can say only that the consumer-price gap the campaign was pointing to is real, and that it survived in a country that is otherwise richer per person than most of the EU members it declined to join.
| Country | GDP per capita, PPP (int'l $) | Inflation (%) | Unemployment (%) | Real GDP growth (%) |
|---|---|---|---|---|
| Norway | 107,900 | 3.2 | 4.0 | 1.4 |
| Denmark | 81,800 | 1.3 | 2.9 | 3.5 |
| Iceland | 78,600 | 5.9 | 3.4 | −1.3 |
| Germany | 71,800 | 2.5 | 3.4 | −0.5 |
| France | 64,100 | 2.3 | 7.4 | 1.1 |
| United Kingdom | 63,100 | 2.5 | 4.3 | 1.1 |
IMF WEO, 2024. GDP per capita is current international dollars (PPPPC). Inflation is average consumer prices (PCPIPCH). Unemployment is the labour-force rate (LUR). Real GDP growth is constant-price percent change (NGDP_RPCH). Figures rounded; exact extracts are in the chart data.
They already did a crash recovery outside the Union
The last time EU membership was a live question, Iceland was in a deep slump. Real GDP fell 8.3 percent in 2009, and general government gross debt reached 137 percent of GDP in 2011. By 2024 it was 60 percent — below Germany’s 62 percent, and a different fiscal world from France or Italy. That path is not a brief for or against Brussels. It is a reminder that the 2026 electorate is not the 2009 one. The island of about 384,000 people that voted in August had already rebuilt a high-income, low-unemployment economy with its own currency.
A current-account deficit of 3.2 percent of GDP in 2024 also cuts against a simple “fisheries surplus funds everything” story. The WEO does not isolate fish exports. The no campaign’s resource argument is a political claim about control of waters, not a finding that marine trade currently pays Iceland’s external bills.
What the vote decided
The referendum did not ask whether Iceland is poor. On the IMF’s comparable accounts, it is not. It asked whether to reopen a sovereignty bargain whose economic pitch, on the yes side, was cheaper credit and, on the no side, control of fish. The books support the unromantic part of both stories at once: living standards are already those of a rich European country, and inflation is still the outlier. They cannot say whether joining would have imported German price stability, and they cannot value the fishing grounds. They can say that Icelanders turned the EU down from the rich end of Europe, with the price gap still open.
Methods and sources
This is retrospective research written on 10 September 2026 about reporting from 30 August 2026. It uses the IMF World Economic Outlook snapshot pinned in MegaVedia’s catalogue on 24 August 2026 (source ingest 10 August 2026), which may include revisions unavailable on digest day. 2024 is treated as the latest completed year; 2025 as a staff estimate; 2026 as a forecast. Series are annual. PPP GDP per capita (PPPPC) is used for same-year living-standards comparisons; NGDPRPPPPC, which matches PPPPC in 2021, is used only for Iceland’s real per-capita change since 2007. Headline average CPI inflation is not core inflation and not a policy rate. Country ranks exclude Ireland and Luxembourg. No euro-area aggregate is used; Germany, Denmark, France, Sweden and Norway are the comparators in the inflation history. Official source: IMF World Economic Outlook.
Research Date
The displayed date matches the related news edition. Research was completed 2026-09-10.
Related news: Daily · 2026-08-30
More Research
Nepal’s Power System Is Hydropower — And It Was Still Being Built
IRENA accounts show Nepal already generates almost all of its electricity from hydropower, and on-grid hydro capacity more than tripled from 2020 to 2025 — the construction boom sitting unde
A Tenth Of Nepal’s Economy, And Almost Every Kilowatt
Nepal’s $4–5 billion glacier-flood reconstruction estimate is a tenth of 2025 output and about half a year’s public revenue, on a grid that already gets 99 percent of its electricity from hy
Japan’s 3% Yield Is A Cheap-Debt Problem, Not A 2025 Blowout
Japan’s 10-year yield at 3 percent is a break with cheap borrowing, not a 2025 IMF budget blowout: the COVID deficit had already narrowed, and residual interest remained tiny beside the Unit