LunarWeave
A Tenth Of Nepal’s Economy, And Almost Every Kilowatt
On 26 August 2026 a Himalayan glacier collapsed on the Nepal–Tibet border and sent ice, rock and mud down the Trishuli valley. By the weekend, rescuers had recovered 633 bodies and were searching for close to 3,000 missing people, including 933 hydropower workers. The Red Cross told AFP that as many as 93,000 people may have been affected. “All the settlements near the river were swept away. There is nothing left,” survivor Buddhi Ram Dangol said.
Nepal’s finance minister then gave Reuters an early reconstruction range of $4–5 billion — “just an estimate,” and, he said, much lower than after the 2015 earthquake. Reporting quickly treated that sum as about a tenth of the national economy. The casualty figures and the dollar range remain reporting, not an audited ledger. What the national accounts can test is whether a bill of that size really is a tenth of output — and what else it would sit beside.
It is a tenth of output. Relative to the government’s own resources, it is far larger. And it landed on a power system that already generated 99 percent of its electricity from the same rivers.
A tenth of output, half a year’s revenue
In the IMF’s current-dollar GDP accounts, Nepal’s 2025 output is $44.8 billion. A $4 billion reconstruction bill is 8.9 percent of that total; $5 billion is 11.2 percent. The midpoint, $4.5 billion, is 10.0 percent. Against the Fund’s 2026 projection of $45.8 billion — a figure that predates the collapse — the same range is 8.7 to 10.9 percent. The “tenth of the economy” framing holds.
Governments do not spend GDP. They spend what they collect. IMF government revenue is 20.0 percent of GDP in 2025, or $8.9 billion. The $4–5 billion range is 45 to 56 percent of that year’s entire public revenue, and 41 to 51 percent of public spending ($9.8 billion). Nepal was not running a large surplus that could absorb it: the 2025 general-government deficit is 1.9 percent of GDP, about $0.8 billion, and gross public debt is 48 percent of GDP.
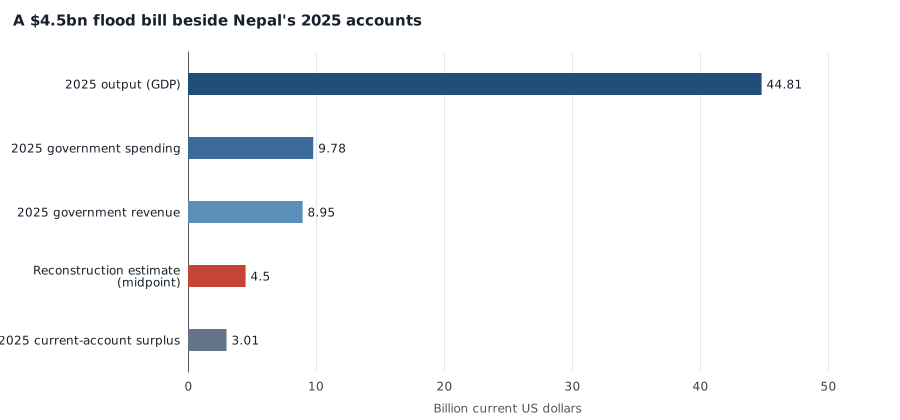
Billion current US dollars. Nepal 2025 IMF World Economic Outlook accounts compared with a $4.5 billion midpoint of the finance minister’s $4–5 billion reconstruction estimate (29 August 2026, via Reuters/Dong-a Ilbo). Government revenue and spending are derived as IMF ratios times 2025 current-dollar GDP. The estimate is not an audited cost, and 2025 IMF figures may still be estimates. Source: IMF World Economic Outlook.
The external books look stronger than the fiscal ones, and still do not cover the bill. The 2025 current-account surplus is $3.0 billion, or 6.7 percent of GDP. Even the low end of the reconstruction range is larger than that surplus. Total investment in the same accounts is $14.2 billion; $4–5 billion would be 28 to 35 percent of a year’s investment, not a rounding error in the capital stock.
| 2025 measure (IMF) | Amount | $4bn share | $5bn share |
|---|---|---|---|
| Output (GDP) | $44.8bn | 8.9% | 11.2% |
| Government revenue | $8.9bn | 45% | 56% |
| Government spending | $9.8bn | 41% | 51% |
| Current-account surplus | $3.0bn | 133% | 166% |
| Total investment | $14.2bn | 28% | 35% |
Per person, using the IMF’s 29.6 million population, the midpoint is about $152 — a tenth of 2025 GDP per capita of $1,512, which is the same ratio in another unit. None of this says Kathmandu will pay the bill from last year’s taxes. It says a sum that sounds like “10 percent of GDP” is closer to half a year of the public purse.
The same rivers run the lights
The missing-persons list is not only villagers and pilgrims. Nepal’s disaster authority added 933 hydropower workers, and the army was trying to reach people trapped in a tunnel at the Trishuli 3A project. That is the country’s power system, not a side sector.
In 2023, the latest year of IRENA generation statistics, Nepal produced 11,550 gigawatt-hours of electricity. Hydropower supplied 11,422 GWh, or 98.9 percent. Solar photovoltaic added 117 GWh, about 1.0 percent. Oil-fired generation, which had been 47 GWh in 2000, was 0.01 GWh. The residual “other” renewables were 11 GWh. Hydropower’s share of generation has sat between 96.6 and 99.3 percent every year since 2000; the recent story is not diversification, it is a much larger hydro system.
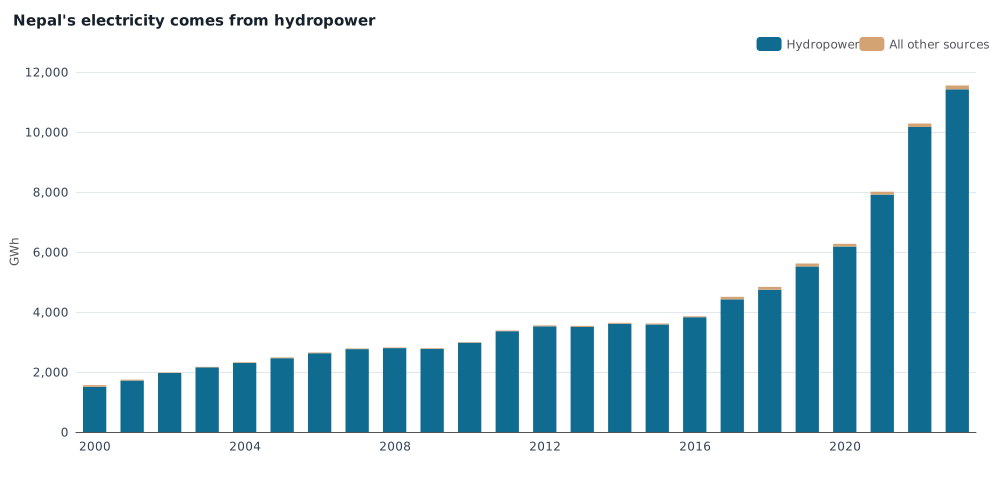
Electricity generation in gigawatt-hours, Nepal, 2000–2023. Hydropower is IRENA renewable hydropower. All other sources combine solar, remaining renewables and non-renewable generation. In 2023 hydropower was 11,422 GWh of 11,550 GWh, or 98.9 percent. Generation is not yet published for 2024–25. Source: IRENASTAT.
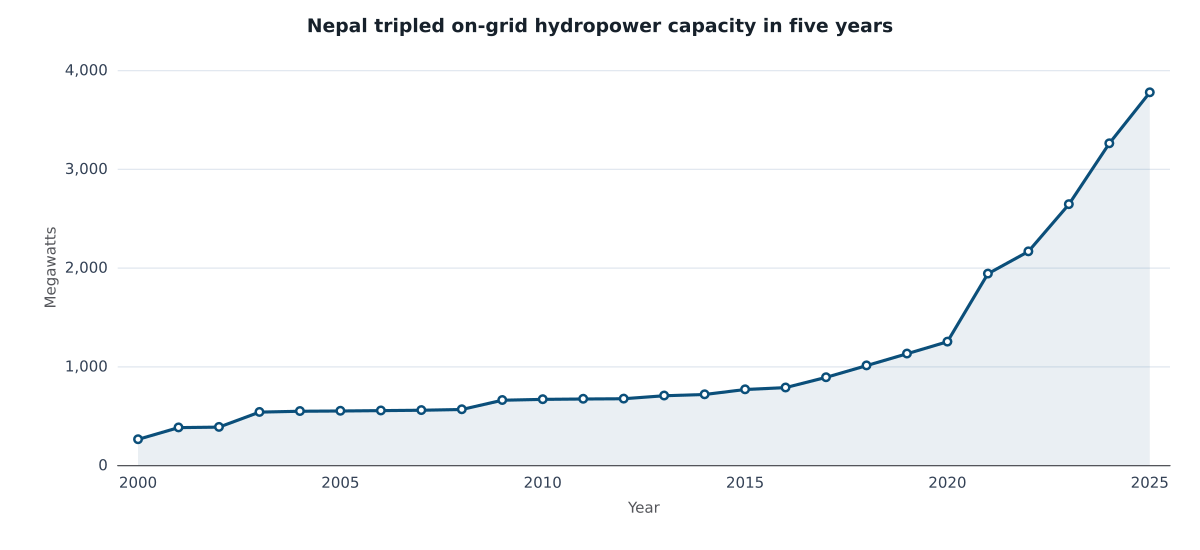
Installed capacity, which IRENA carries through 2025, shows how fast that system had been growing. On-grid hydropower rose from 1,937 megawatts in 2021 to 3,772 MW in 2025 — nearly double in four years — and was 94.6 percent of on-grid capacity. Other renewable plants reached 162 MW. Non-renewable capacity has been unchanged at 53 MW since 2000, which matches the near-disappearance of oil-fired generation. A further 38 MW of off-grid hydro is small beside the grid.
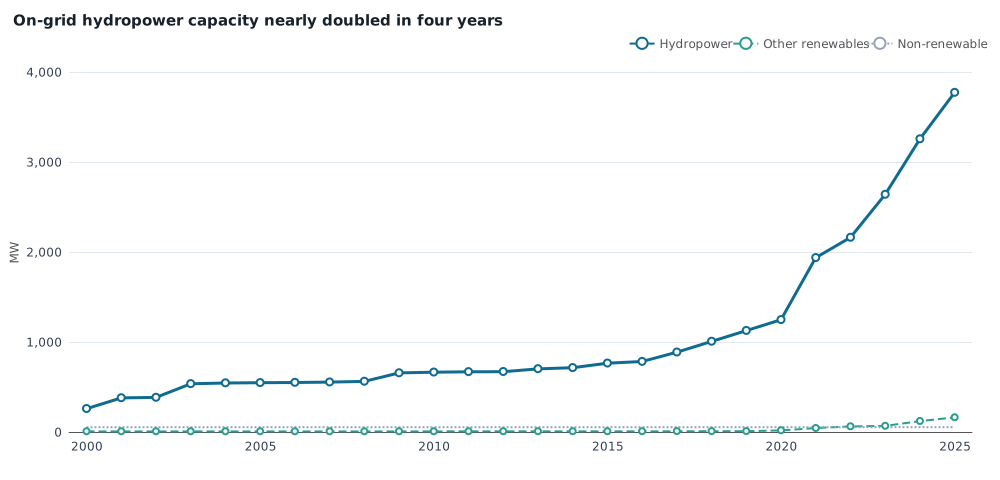
On-grid electricity capacity in megawatts, Nepal, 2000–2025. Hydropower rose from 1,937 MW in 2021 to 3,772 MW in 2025. These are installed-capacity figures, not a measure of how much plant the flood destroyed. Source: IRENASTAT.
Capacity is not the same as surviving plant, and 2023 generation is not 2026 output. The statistics cannot say how many megawatts the debris flow buried. They can say that a flood down the hydropower valleys hit an economy whose lights, unlike most countries’, have almost no other source.
An already slower year in the books
The IMF’s 2025 real-growth estimate for Nepal is 4.6 percent. Its 2026 projection, locked in a snapshot created two days before the collapse, is 3.0 percent. That slowdown was already in the books. It is not a forecast of the flood.
The closest analogue in the same series is the year after the April 2015 earthquake. Real growth was 4.0 percent in 2015 and 0.4 percent in 2016. That is a 3.5 percentage-point drop, not a template. The finance minister said this reconstruction bill would be much lower than after 2015; the 2015 dollar cost is not in these datasets, and 2015 GDP itself was only $24.4 billion, so a smaller bill today can still be a similar share of a larger economy.
Aid, insurance and private rebuilding will decide how much of the $4–5 billion lands on the budget. The national accounts only show the scale of the hole relative to what Nepal produces, collects and already generates from its rivers.
Sources and methods
This is retrospective research completed on 10 September 2026, using pinned IMF World Economic Outlook and IRENA snapshots created on 24 August 2026. The underlying reporting is dated 29 August 2026. Later data were not available that day; observation years are not release dates.
IMF figures are annual World Economic Outlook series for Nepal (NPL). Years 2026–2031 are treated as projections. 2025 is the latest near-complete year in the snapshot and may still be an estimate. Dollar GDP is current prices, not inflation-adjusted volume. Government revenue, spending, the deficit and investment in dollars are the IMF’s percent-of-GDP ratios multiplied by the same vintage of current-dollar GDP. The current-account dollar series matches that ratio. IRENA generation is “all” grids through 2023; capacity shares use on-grid series through 2025. Hydropower here is IRENA’s renewable hydropower, not pumped storage.
The $4–5 billion reconstruction range, the death and missing counts, the 933 hydropower workers and the Red Cross 93,000 figure are reported claims from The Dong-a Ilbo (citing Reuters) and Dawn (carrying AFP). They are not independently verified here. MacroVedia pages linked above are multi-country charts: choose Nepal. Live values for the cited years matched this IMF snapshot; the portals are not the original statistical producers. Official sources remain the IMF World Economic Outlook and IRENASTAT. SVG rendering is not browser or mobile layout QA.
Research Date
The displayed date matches the related news edition. Research was completed 2026-09-10.
Related news: Daily · 2026-08-29
More Research
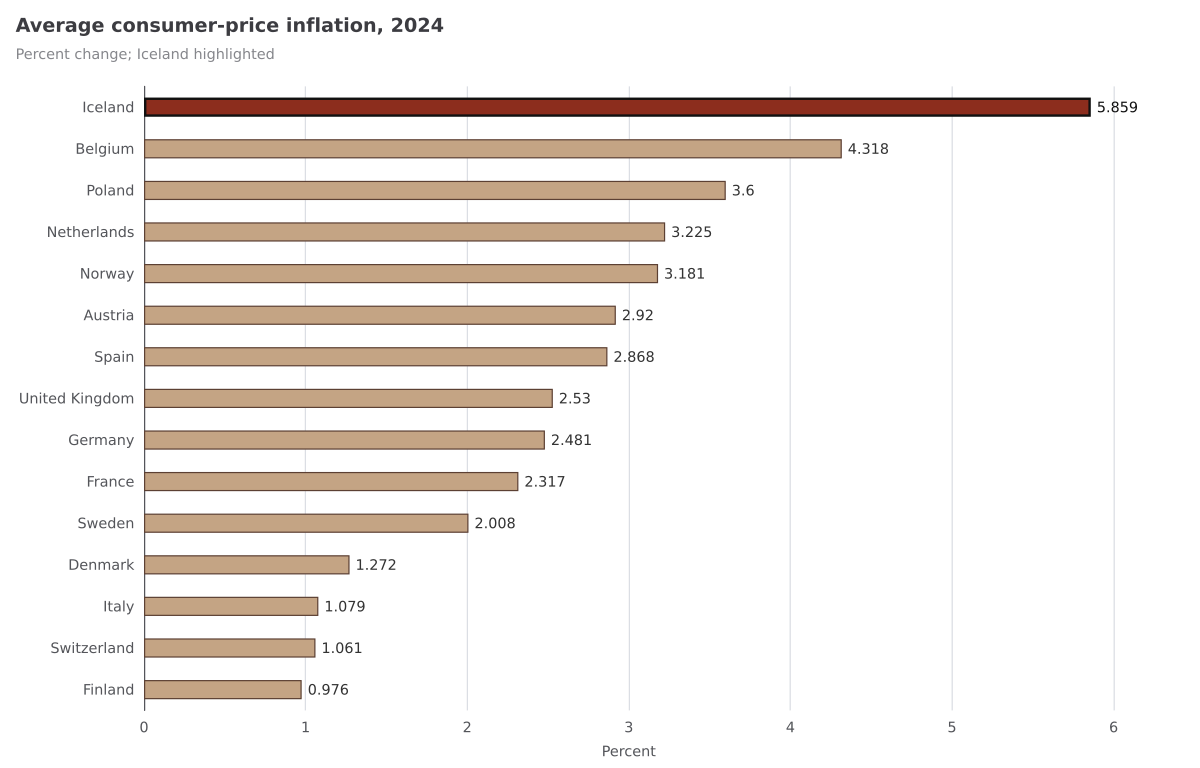
Iceland Voted No Already Richer Than Germany — With Inflation Still The Outlier
Iceland’s 2026 EU-talks referendum was not a poor-applicant vote: IMF accounts put 2024 GDP per capita above Germany, while inflation remained the highest among European peers.
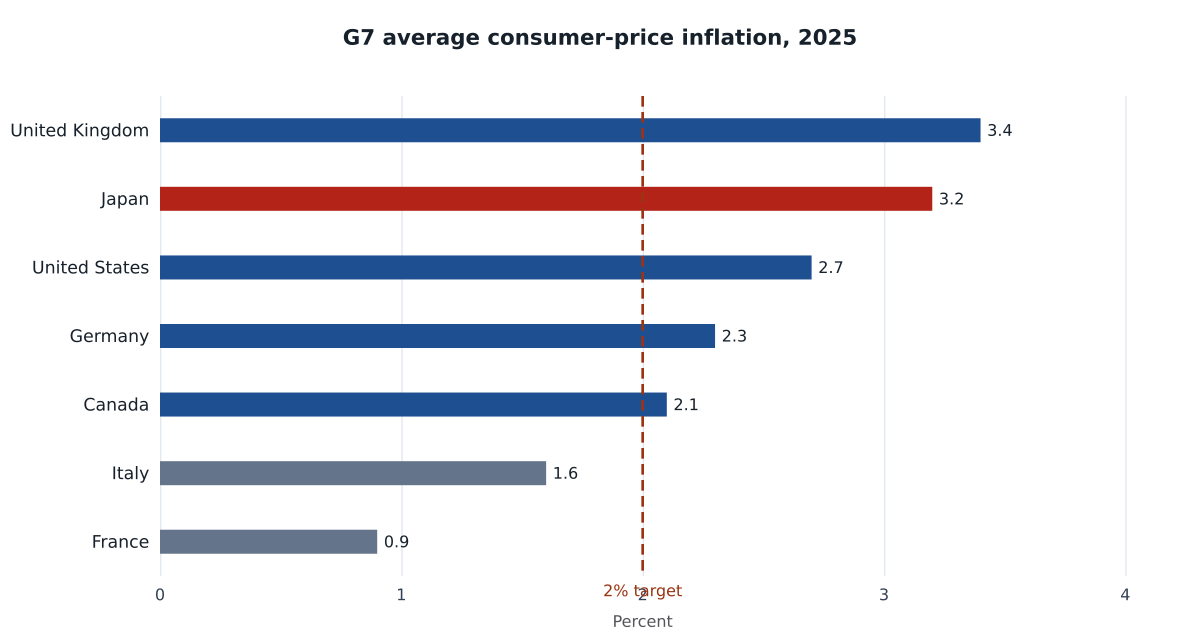
Japan’s Inflation Is Now Higher Than America’s
IMF average CPI inflation was above 2% in the United States for five calendar years through 2025. Japan has now had four such years, and in 2025 Japanese inflation ran higher than America’s.
Nepal’s Power System Is Hydropower — And It Was Still Being Built
IRENA accounts show Nepal already generates almost all of its electricity from hydropower, and on-grid hydro capacity more than tripled from 2020 to 2025 — the construction boom sitting unde