LunarWeave
Nepal’s Electricity Now Hangs On Himalayan Rivers
A glacier collapse on the Nepal–Tibet border sent flash floods through mountain valleys in late August 2026. The Independent reported that people from more than 30 countries were missing; Nepal’s tourism office told Globo it still could not reach 517 foreign visitors a day later. Death and missing counts were still moving. The humanitarian question is immediate. A quieter one sits underneath it: how much of Nepal’s power system now depends on the same Himalayan rivers?
The answer in the official generation accounts is almost all of it. That has been true for years. What changed is the size of the bet.
The rivers already supplied the grid. Then the grid got much larger.
In 2023, the latest year in the International Renewable Energy Agency country generation tables, Nepal produced 11,422 gigawatt-hours of hydropower out of 11,550 GWh of electricity generated on its territory — 98.9 percent. Solar photovoltaic plants contributed 117 GWh, or 1.0 percent. Oil-fired generation was 0.01 GWh, indistinguishable from zero on any ordinary chart.
That hydro share is not new. It was already 96.6 percent in 2000, when oil still supplied 47 GWh, about 3 percent of a much smaller system. The change is scale. Hydropower output more than doubled in four years, from 5,521 GWh in 2019 to 11,422 GWh in 2023. The dashed line in the chart below — total generation — sits almost on top of hydropower because nothing else of size is left.
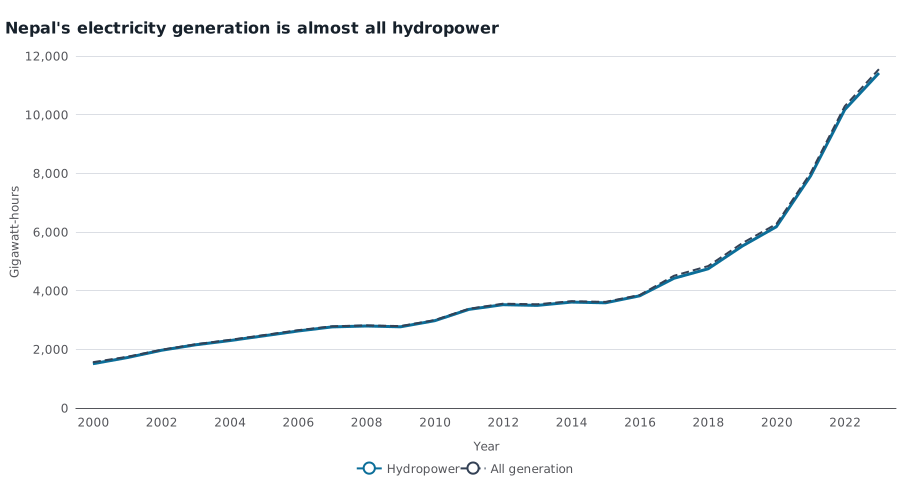
Electricity generated in Nepal, gigawatt-hours, 2000–2023. Hydropower was 11,422 GWh of 11,550 GWh in 2023. The dashed line is IRENA total renewable plus total non-renewable generation. These are kilowatt-hours produced in Nepal, not electricity consumed after trade with India. Source: IRENASTAT.
Capacity figures, which run two years later than generation, show the same turn. On-grid hydropower capacity rose from 1,127 megawatts in 2019 to 3,772 MW in 2025 — more than a threefold increase. Including 38 MW of off-grid hydro, Nepal’s recorded hydro fleet was 3,810 MW in 2025, 93.3 percent of known capacity.
| Source, 2023 | Generation (GWh) | Share of total |
|---|---|---|
| Hydropower | 11,422 | 98.9% |
| Solar photovoltaic | 117 | 1.0% |
| Oil | 0.01 | ~0% |
| Total | 11,550 | 100% |
Total is IRENA renewable plus non-renewable generation. Other non-solar renewables are about 11 GWh.
The oil plants are still on the books. They barely run.
IRENA records 53.41 MW of on-grid oil capacity in every year from 2000 through 2025. That number never changes, so it may be a carried-forward stock rather than a plant list that was resurveyed each year. Two other series are less ambiguous. On-grid non-renewable capacity equals that oil figure in every year — Nepal has no recorded coal or gas fleet in these tables — and oil generation itself fell from 47 GWh in 2000 to 0.01 GWh in 2023. Whatever those oil units are, they are not supplying the country.
Solar is growing from a low base. On-grid solar photovoltaic capacity rose from 1.8 MW in 2019 to 156 MW in 2025, 3.8 percent of known capacity. In the 2023 generation accounts it was still 1 percent of output. Hydropower remains the system.
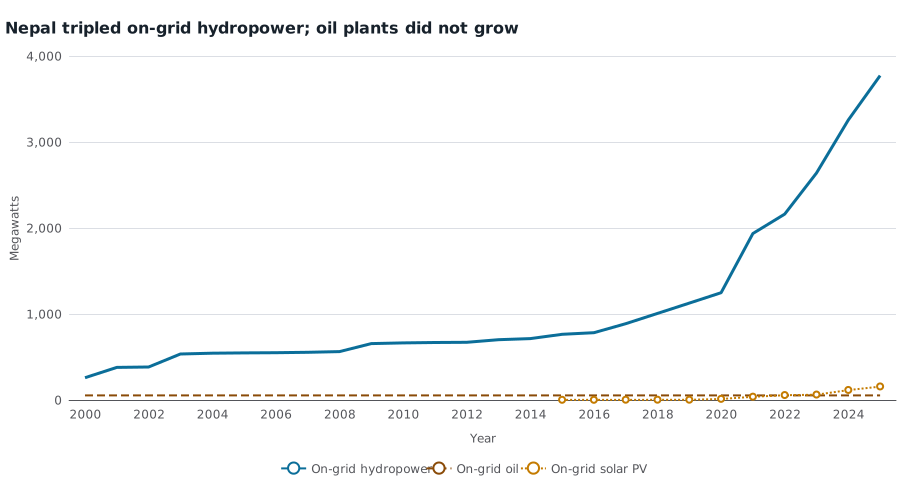
Installed on-grid capacity in Nepal, megawatts, 2000–2025. Hydropower rose from 1,127 MW in 2019 to 3,772 MW in 2025. Oil is recorded as 53.41 MW every year. Solar PV observations begin in 2015; earlier years are omitted, not zero. Source: IRENASTAT.
None of this measures damage from the August 2026 floods. IRENA’s generation series stops in 2023; capacity stops in 2025. A glacier collapse can wreck roads, villages and tourism without touching a dam — or it can take hydropower offline. The data cannot say which happened. They can say that if Himalayan water fails, Nepal has almost no domestic generation left to replace it.
Next door, India still burns other fuels. Bhutan does not.
Bhutan, Nepal’s smaller Himalayan neighbour, generated 99.99 percent of its 2023 electricity from hydropower. India, whose citizens were the largest group among the unreachable visitors in Globo’s report, generated 8.7 percent of a far larger system from hydro. The same mountain chain does not imply the same power mix. Nepal and Bhutan run on rivers. India does not.
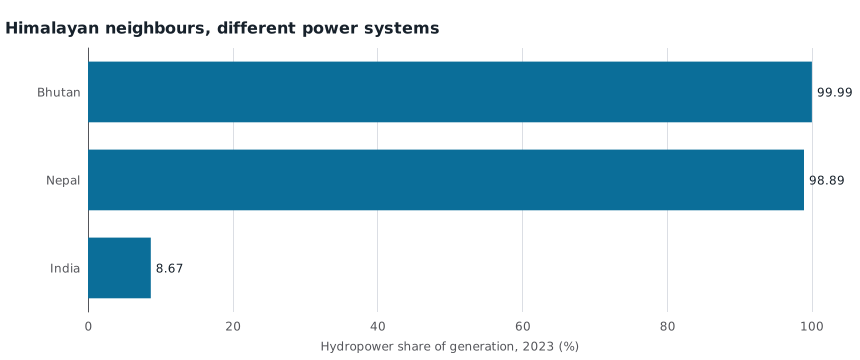
Hydropower as a share of electricity generation in 2023. Share is IRENA renewable hydropower divided by total renewable plus total non-renewable generation on each country’s territory. Source: IRENASTAT.
Trade cuts both ways. Nepal exports and imports power with India; generation on Nepalese territory is not the same as the mix that reaches Nepalese sockets, and India’s coal-heavy system is a possible backup across the border. That interconnection is real. It is also not a domestic oil or gas fleet. In the IRENA accounts, Nepal did not keep one.
A $45 billion economy, with the flood not yet in the forecast
The IMF’s World Economic Outlook puts Nepal’s output at $44.8 billion in 2025, for 29.6 million people, or about $6,181 per person in current international dollars. Those 2025 figures are IMF estimates. Real growth was 2.0 percent in 2023. The Fund’s 2026 projection is 3.0 percent. It does not include the August floods.
The last near-stall in these accounts was 2016, when real output rose 0.4 percent. In 2020 it contracted 2.4 percent. General government gross debt is estimated at 48.1 percent of GDP in 2025, with a budget deficit of 1.9 percent of GDP. That is not a fiscal emergency on paper. It is also not a large, diversified industrial economy that can shrug off a disaster in the valleys that now hold most of its power stations.
The floods’ cost to generation, tourism or reconstruction is not in these tables. What the tables show is a country that spent the years before the collapse making Himalayan hydropower bigger, not more substitutable.
Methods and sources
This article is retrospective research dated 10 September 2026, using pinned IRENA and IMF snapshots available then. The floods were reported on 27 August 2026. Later releases are not implied to have been known that day.
Electricity figures are IRENASTAT country series: renewable hydropower, total renewable and total non-renewable generation (all grids), on- and off-grid capacity, and on-grid oil and solar photovoltaic capacity. Total generation is renewable plus non-renewable. Known capacity is on-grid renewable plus on-grid non-renewable plus off-grid renewable; off-grid non-renewable returned no rows and is not treated as zero. Hydropower generation is a subset of renewable generation. Oil generation matches total non-renewable generation in every overlapping year.
IMF series are current-dollar GDP, real GDP growth, GDP per capita in current international dollars, population, general government net lending/borrowing and gross debt, from the World Economic Outlook extract. Values for 2025–26, and possibly 2024, are estimates or projections. MacroVedia pages are the same IMF measures; choose Nepal in the chart. They are not the original source.
Death, missing and tourism figures are contemporaneous news reports, not official tallies verified here.
Research Date
The displayed date matches the related news edition. Research was completed 2026-09-10.
Related news: Daily · 2026-08-27
More Research
Japan’s Inflation Is Now Higher Than America’s
IMF average CPI inflation was above 2% in the United States for five calendar years through 2025. Japan has now had four such years, and in 2025 Japanese inflation ran higher than America’s.
Qatar’s Worst Slump In A Generation Still Leaves An 11 Percent Surplus
IMF accounts already put Qatar in a worse 2026 slump than Covid, with goods exports down about a fifth — and still an 11 percent current-account surplus.
A Tenth Of Nepal’s Economy, And Almost Every Kilowatt
Nepal’s $4–5 billion glacier-flood reconstruction estimate is a tenth of 2025 output and about half a year’s public revenue, on a grid that already gets 99 percent of its electricity from hy