LunarWeave
China’s Population Peaked In 2021. India’s Rise Is Still Much Larger.
A Danish report in late August 2026 described young Chinese people walking away from marriage and children, with the Communist Party looking to universities for help. In the same news cycle, Izvestia summarized two economists arguing that global fertility has already slipped below replacement and that world population may peak around the mid-2050s. Those are social and long-run claims. They raise a simpler question the headcount can answer now: has China’s population already started to fall, and is that decline large enough to look like a global turning point?
In the International Monetary Fund’s World Economic Outlook population series, China has already turned down. The same figures show why that is not yet a story of world population decline.
The peak was 2021, and it was quiet
China’s annual population in this IMF series rose from 987.1 million in 1980 to a high of 1,412.6 million in 2021. By 2024 it was 1,408.3 million — 4.32 million people fewer than at the peak, a drop of 0.31 percent over three years.
The last year of growth was already a trickle. From 2020 to 2021 China added only 480,000 people. Then the series fell in 2022, 2023 and 2024. That is a real peak, not a one-year dip. It is also not a collapse. Losing 4.32 million people from a base of 1.41 billion is a slow turn, not an emptying country.
The IMF series is an annual population total, not a fertility rate, a marriage count or a census-day snapshot. It cannot say why births fell, and it cannot measure how many young adults are remaining single. What it can do is test the headcount claim inside the marriage reporting: the population has started to shrink.
India overtook China in the same year
The more consequential number sits next door. In 2020 China was still larger than India, by 9.50 million people (1,412.1 million against 1,402.6 million). In 2021, the year China’s series peaked, India was already larger: 1,414.2 million against 1,412.6 million.
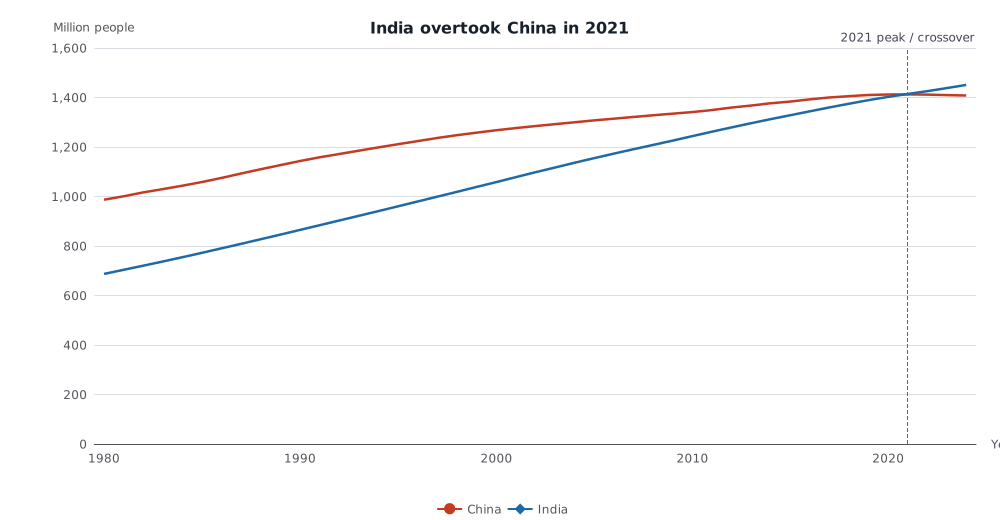
IMF World Economic Outlook annual population, million people, 1980–2024. China peaked at 1,412.6 million in 2021; India was already larger that year. Figures are persons divided by 1,000,000. Years after 2024 in this WEO snapshot are estimates and are omitted here. Source: IMF WEO population (LP). Readers can inspect the same series, and switch geography, on MacroVedia’s population page.
From 2021 to 2024 India added 36.73 million people. That gain is about 8.5 times the 4.32 million China lost over the same years. The United States, far smaller, still added 7.54 million. Among large countries that are shrinking, Japan’s three-year decline was steeper in percentage terms (1.28 percent) than China’s, and Japan’s IMF series peaked back in 2011.
| Country | 2021 | 2024 | Change | Percent |
|---|---|---|---|---|
| India | 1,414.2 million | 1,450.9 million | +36.73 million | +2.60% |
| United States | 332.5 million | 340.0 million | +7.54 million | +2.27% |
| Germany | 82.0 million | 83.5 million | +1.52 million | +1.86% |
| Russia | 145.8 million | 144.8 million | −1.02 million | −0.70% |
| Japan | 125.5 million | 123.9 million | −1.60 million | −1.28% |
| China | 1,412.6 million | 1,408.3 million | −4.32 million | −0.31% |
Annual IMF WEO population, persons converted to millions. Russia’s series in this snapshot begins in 1989; the 2021–2024 comparison uses years that are present. These six countries are not a world total.
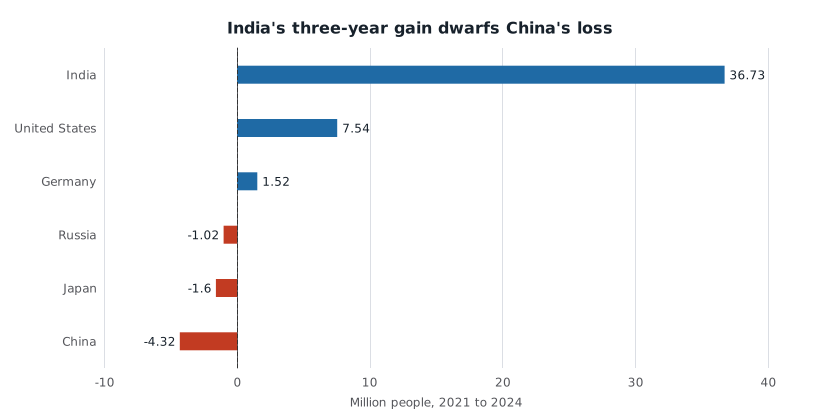
Change in IMF WEO annual population, million people, 2021 to 2024. The six countries are a comparison set, not a global aggregate. Source: IMF WEO population (LP).
An “era of decline” is not a headcount fact yet
The Izvestia summary treated falling fertility as the start of a global population era, while still placing any world peak decades away. This research does not test that paper, and it does not have a world total. What the country series do show is a split.
China has entered decline. Japan has been in it longer, and Russia’s 2024 headcount is also below 2021. India and the United States have not. India’s three-year addition alone more than offsets the combined 2021–2024 losses of China, Japan and Russia in this set (6.94 million). Adding the U.S. gain makes the imbalance larger still.
That is why a China marriage crisis and a global-peak forecast can appear in the same news cycle without contradicting the IMF totals. China can already be shrinking while the largest countries, taken together, are still adding people. A world turning point, if it comes, is not visible in these 2024 headcounts.
The IMF snapshot also carries figures for 2025–2031. Those later years are the WEO’s projected path, not census counts, and they are not used in the comparisons above. They continue to show a smaller China and a larger India. They do not convert a slow Chinese decline into a global one.
What the evidence cannot settle
Population totals move with births, deaths and migration. China’s 4.32 million drop does not isolate how much came from fewer marriages, fewer births, COVID-era deaths, or emigration. Japan’s longer decline is a warning that East Asian shrinkage can persist, not proof that China will follow Japan’s percentage path. Germany’s 2021–2024 increase is a reminder that rich countries can still grow even with low fertility, typically through migration — another measure this series does not split out.
The marriage reporting and the mid-2050s world-peak estimate remain reported claims. The IMF headcount answers a narrower question, and it answers it clearly: China has already peaked, the decline is still small, and India’s growth is still in a different league.
Sources and methods. Retrospective research on 10 September 2026, using a pinned IMF World Economic Outlook snapshot packaged on 24 August 2026 (raw run 10 August 2026), not the information set available on the 25 August 2026 news day. The measure is IMF WEO population (LP), unit persons, annual, for CHN, IND, USA, JPN, RUS and DEU. Millions in the text and charts are that series divided by 1,000,000. Comparisons use 1980–2024, with 2024 treated as the latest historical year in the snapshot; 2025–2031 are retained only as labeled WEO estimates. Russia has no observations before 1989. Missing years are omitted, never filled with zero. Live MacroVedia values for China and India in 2020, 2021 and 2024 matched this snapshot; the page is multi-country, so the geography has to be selected in the chart. Official source: IMF World Economic Outlook. Charts were rendered to SVG; they have not been separately tested in a browser or on a phone.
Research Date
The displayed date matches the related news edition. Research was completed 2026-09-10.
Related news: Daily · 2026-08-25
More Research
Qatar’s Worst Slump In A Generation Still Leaves An 11 Percent Surplus
IMF accounts already put Qatar in a worse 2026 slump than Covid, with goods exports down about a fifth — and still an 11 percent current-account surplus.
The $103,000 H-1B Fee Is 42 Weeks Of Tech-Services Pay
The proposed $103,265 H-1B fee equals 42 weeks of average pay in computer systems design, an industry already 117,000 jobs below its 2023 peak.
Nepal’s Electricity Now Hangs On Himalayan Rivers
Nepal generates 98.9 percent of its electricity from hydropower and more than tripled on-grid hydro capacity from 2019 to 2025, leaving almost no domestic thermal backup after a Himalayan gl