LunarWeave
The Paycheck Is A Shrinking Share Of America's Official Income
Households judging the economy by what hits the checking account are not looking at the same object economists call personal income. That distinction matters as consumer sentiment is reported near a record low, a Reuters/Ipsos poll finds most Americans saying prices are outrunning their earnings, and Brent crude is reported above $116 a barrel. The poll and the oil print are reporting, not figures checked here. The income accounts are.
The Bureau of Economic Analysis builds U.S. personal income as the sum of three pieces: net earnings by place of residence (pay for work, after social-insurance contributions and a residence adjustment), dividends, interest and rent, and personal current transfer receipts. In the second quarter of 2026 those pieces ran at a $27.37 trillion seasonally adjusted annual rate, or $79,904 per person. Work still supplies most of the total. It supplies less of it than it did on the eve of the pandemic.
The ledger is less of a paycheck
In 2019 Q4, net earnings were 63.2% of personal income. By 2026 Q2 they were 59.9%. Dividends, interest and rent rose from 19.7% to 21.4%. Transfer receipts rose from 17.1% to 18.7%. Wages and salaries — the closest official stand-in for a paycheck, and not an additive slice of the total — slipped from 51.0% of personal income to 49.2%.
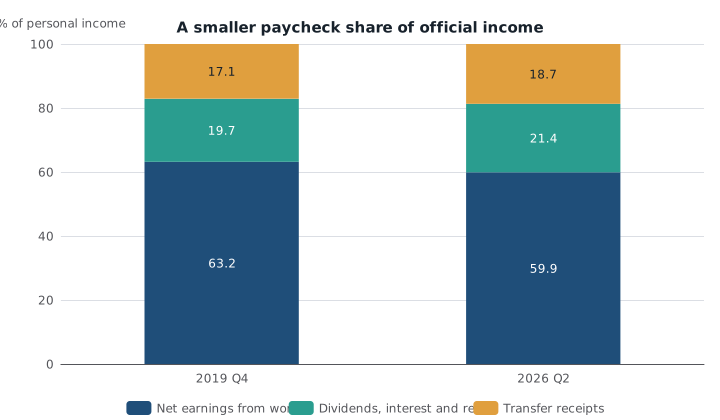
Share of U.S. personal income from net earnings, dividends/interest/rent, and transfer receipts. Seasonally adjusted annual rates. The three categories sum to personal income. Source: U.S. Bureau of Economic Analysis, SQINC4. Current-dollar shares, not inflation-adjusted.
The pandemic years briefly broke the ledger. Transfer receipts jumped to more than a quarter of personal income in 2020 Q2 and 2021 Q1, when relief checks and expanded unemployment insurance flooded the accounts. That spike reversed. What did not fully reverse is the mix after it.
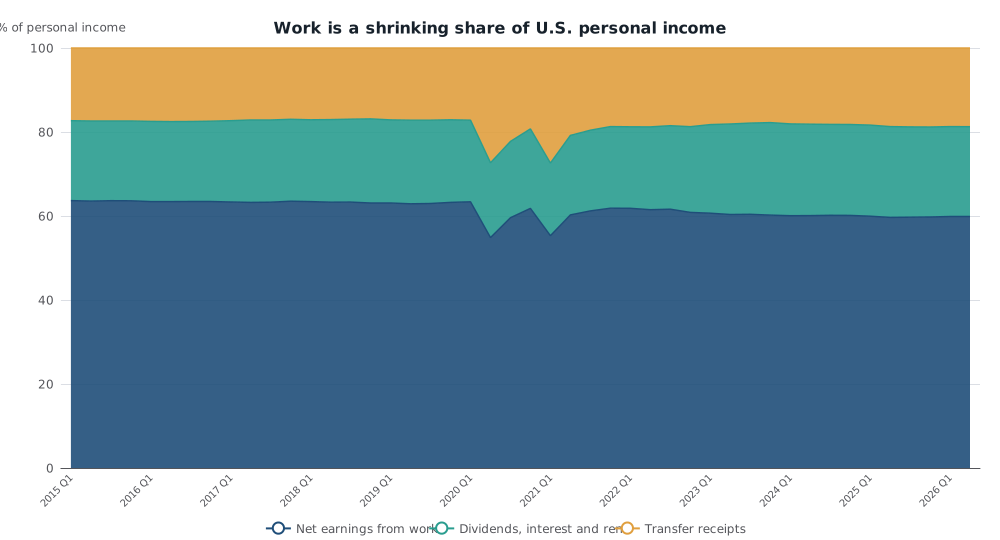
Stacked shares of U.S. personal income, 2015 Q1–2026 Q2, seasonally adjusted annual rates. Net earnings plus dividends, interest and rent plus transfers equal the total. Source: BEA, SQINC4.
Transfers and asset income grew faster than wages
From 2019 Q4 to 2026 Q2, personal income rose 47.3% in current dollars. Transfer receipts rose 61.6% and dividends, interest and rent 60.0%. Wages rose 42.4%; net earnings, 39.5%. Indexed to the last quarter of 2019, both transfers and asset income are near 160 in mid-2026. Wages are at 142.
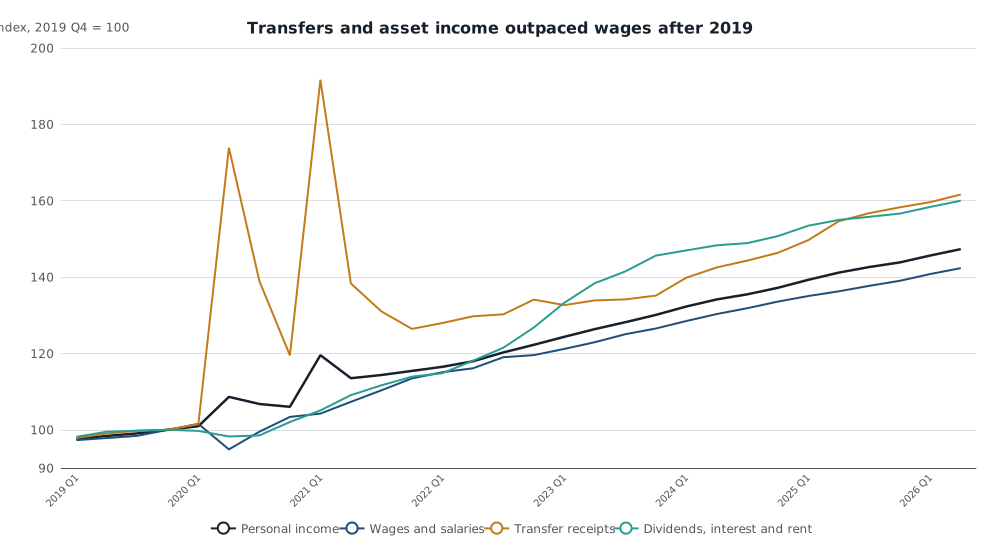
Index of U.S. seasonally adjusted annual-rate totals, 2019 Q4 = 100. Wages are shown for comparison; they are not an additive part of personal income. Source: BEA, SQINC4.
Work still provided most of the dollars. Of the $8.79 trillion increase in the personal-income annual rate since 2019 Q4, net earnings accounted for 52.8%, asset income 25.0%, and transfers 22.2%. The paycheck did not stall. Other income streams simply grew faster, so work became a smaller share of a larger total.
The extra transfers are not leftover stimulus. Social Security, Medicare and Medicaid were 77.7% of transfer receipts in 2019 Q4, crashed to 43.8% at the 2021 Q1 relief peak, and were 78.9% again in 2026 Q2. Medicaid rose 76.7% over that span, the fastest of the three. In 2026 Q2, Medicare and Medicaid together were 8.8% of personal income. BEA counts those health benefits as income. Households do not receive them as cash, which is one reason a rising income total can coexist with a sour reading of “pay.”
| Share of U.S. personal income | 2019 Q4 | 2026 Q2 |
|---|---|---|
| Net earnings from work | 63.2% | 59.9% |
| Dividends, interest and rent | 19.7% | 21.4% |
| Transfer receipts | 17.1% | 18.7% |
| Wages and salaries (not additive) | 51.0% | 49.2% |
The most recent year looks different from the six-year shift. From 2025 Q2 to 2026 Q2, wages rose 4.4%, matching personal income’s 4.4%; transfers rose 4.5% and asset income 3.2%. Per-person nominal income was up 4.1%. The composition change is a post-2019 fact, not a 2026 acceleration. Year-over-year growth in the personal-income annual rate has also slowed, from 5.7% in 2024 Q3 to 4.4% in 2026 Q2.
Prices already took a bite that 2024 had not fully reversed
Current-dollar income cannot answer whether prices are outrunning pay. BEA’s real per capita personal income, which uses regional price parities and the national PCE price index, ends in 2024. In 2017 dollars, income per person was $53,683 in 2019, peaked at $59,365 in 2021, fell 3.8% to $57,104 in 2022, and recovered to $59,195 in 2024 — 10.3% above 2019 and still 0.3% short of 2021.
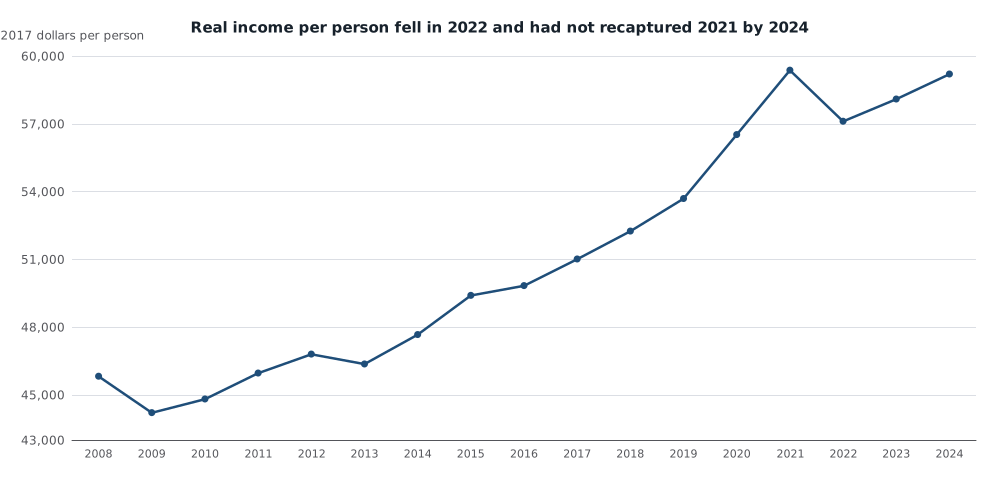
U.S. real per capita personal income, constant 2017 dollars, annual. The series ends in 2024 and cannot price-adjust 2025–26 nominal income. Source: BEA real personal income by state.
That 2022 drop mixed fading pandemic transfers with the inflation spike. It does not measure 2025–26, and it does not isolate wages from Medicare or from homeowners’ imputed rent. It does show that the last complete inflation-adjusted reading had not recaptured the 2021 peak.
What the accounts cannot settle
These figures are national averages at annual rates, from BEA’s September 30, 2026 regional release through 2026 Q2. They do not say whether any household’s paycheck beat its grocery bill in October. They cannot attribute 2026 prices to any administration’s policies. They do not include the reported autumn oil spike: the second quarter ended in June.
They do show why “income is up” and “pay feels behind” can both be true. A growing minority of the official total is asset income, and another slice is transfers — much of it Social Security and in-kind health benefits rather than a wage. Voters arguing about prices versus pay are talking about a narrower, more cash-like object than the headline personal-income number.
Methods and sources
This is a retrospective analysis of the October 24, 2026 news, written on October 25, 2026 from pinned BEA snapshots. Quarterly series are United States totals, seasonally adjusted annual rates, current dollars, 2015 Q1–2026 Q2, from BEA table SQINC4 and related SQINC transfer-receipt lines (regional methodology). Social Security, Medicare and Medicaid are stored in thousands of dollars and were converted to millions by dividing by 1,000 before comparison with the transfers total. Real per capita personal income is annual, constant 2017 dollars, 2008–2024. Calculations are in analysis/calculate.py. BEA state personal income is subject to revision. Browser and mobile chart layout were not separately tested beyond SVG rendering.
Research Date
The displayed date matches the related news edition. Research was completed 2026-10-25.
Related news: Daily · 2026-10-24
More Research
Georgia Already Builds Cars. Audi Is Joining A Small, Rebuilt Industry.
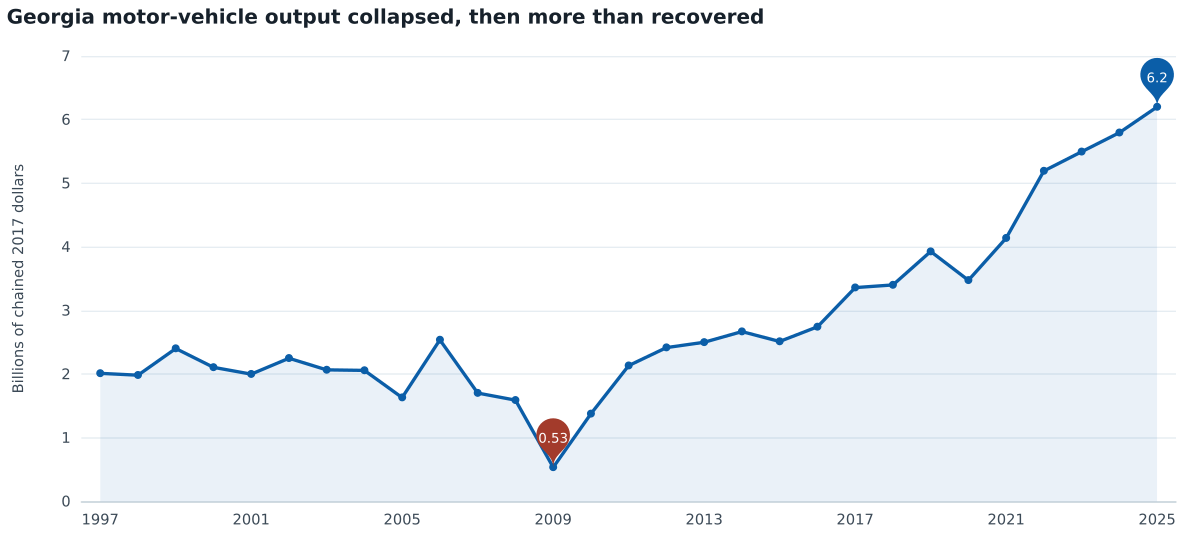
Georgia’s motor-vehicle industry collapsed in 2009 and came back. Audi’s $4 billion plant is large for that rebuilt, still-small auto state.
New York Is Where The Diesel Is Docking. It Is Not Where Households Spend The Most On Fuel.
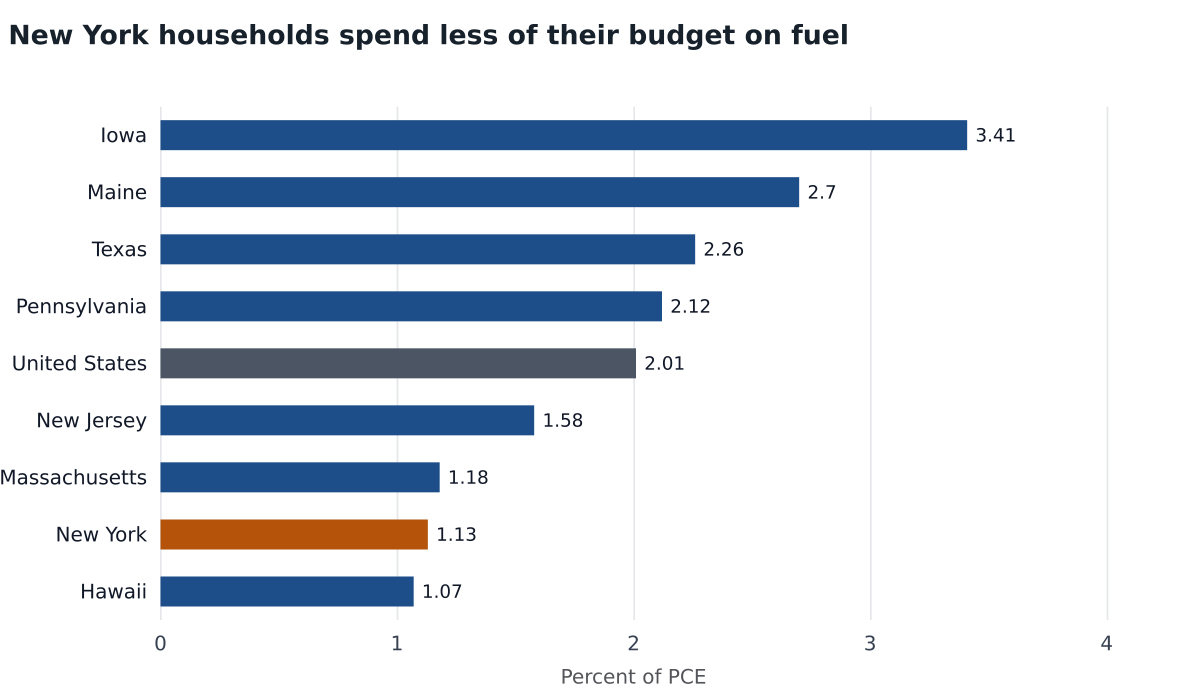
A diesel cargo bound for New York does not mean New York households spend the most on fuel. In 2025 they ranked 50th of 51 on energy goods as a share of consumption.
Microsoft’s 60,000-Person Offer Is Almost The Size Of Seattle’s Software Payroll
Microsoft’s 60,000-person voluntary-exit pool is 92 percent as large as Seattle-area software-publishing employment, a payroll already 16.6 percent below its 2022 peak even as Washington inf