LunarWeave
New York Is Where The Diesel Is Docking. It Is Not Where Households Spend The Most On Fuel.
A Maltese-flagged tanker carrying 40,000 tons of Russian diesel is bound for New York under a Trump–Putin supply deal, according to ship-tracking reports. Pump diesel in the United States had already been reported at a record $6.53 a gallon at the end of September. The destination makes it easy to imagine New Yorkers as the households most on the hook.
They are not. In the latest Bureau of Economic Analysis state accounts, gasoline and other energy goods took 1.13% of New York personal consumption in 2025. The U.S. figure was 2.01%. Only Hawaii, at 1.07%, devoted a smaller slice of spending to that category. The gap is old, not a one-year quirk: New York has ranked 50th or 51st among the 50 states and the District of Columbia on this measure in every year since 1997.
That does not make the cargo irrelevant. New York Harbor is a petroleum port, and New York and Pennsylvania still account for a large share of the country's leftover household fuel-oil bill. It does mean a tanker aimed at New York is a logistics story and a national price story — not evidence that New York households run the most fuel-heavy budgets in America.
A small fuel line in a large, urban budget
"Gasoline and other energy goods" in the BEA's product-type accounts is household spending on motor-vehicle fuels, lubricants and fluids plus fuel oil and other fuels. It is a current-dollar total, so it moves when prices move. It is not a gallon count, and it is not the diesel that trucking companies buy: that is business intermediate consumption, outside personal consumption.
On that household measure, New York is near the bottom of the country.
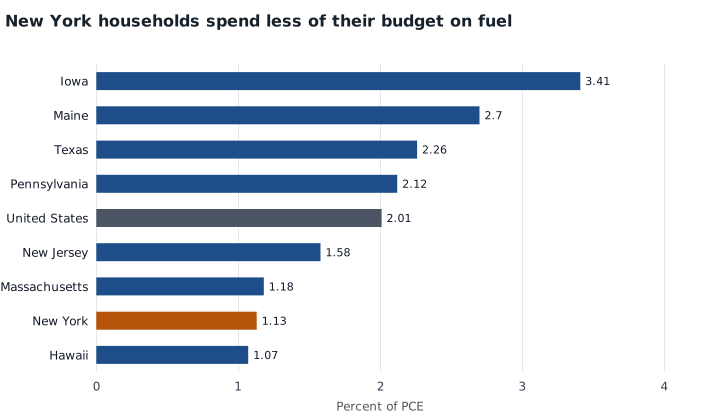
Gasoline and other energy goods as a share of personal consumption expenditures, 2025, selected states. Units: percent of total PCE, BEA current-dollar state accounts. New York is highlighted. The United States bar is the national aggregate. These 2025 annual accounts do not include the October 2026 diesel-price spike.
Iowans put 3.41% of consumption into energy goods — three times New York's share. Texans, in a large driving state that also produces oil, put in 2.26%, and spent $40.1 billion in all, 2.55 times New York's $15.7 billion. Maine, the New England state that still looks like a heating-oil story, put in 2.70%.
Per person the same pattern holds. BEA's published per-capita series shows $786 of energy-goods spending in New York in 2025, against $1,225 for the United States, $1,265 in Texas and $1,767 in Maine. New Yorkers spent 36% less per person than the national figure, and less than half as much as Mainers.
| Place | Energy goods, share of PCE | Energy goods per person | Fuel oil share of energy goods |
|---|---|---|---|
| Iowa | 3.41% | $1,750 | 5.9% |
| Maine | 2.70% | $1,767 | 13.6% |
| Texas | 2.26% | $1,265 | 4.2% |
| Pennsylvania | 2.12% | $1,323 | 15.4% |
| United States | 2.01% | $1,225 | 6.9% |
| New York | 1.13% | $786 | 17.0% |
| Hawaii | 1.07% | $684 | 15.1% |
BEA state personal consumption expenditures by type of product, 2025, current dollars. Per-person figures are BEA's published per-capita series, not a separate population calculation. Fuel oil share is fuel oil and other fuels divided by gasoline and other energy goods.
Dense transit, shorter drives and high spending on housing and services all shrink fuel's weight in a New York budget. The BEA New England region as a whole, despite its heating-oil reputation, still spent only 1.49% of consumption on energy goods — below the national share — because Massachusetts and Connecticut look more like New York than like Maine.
What is distinctive is the mix, not the burden
The one way New York does stand out is inside that already-small fuel bill. Fuel oil and other fuels — household heating oil, propane and similar products — were 17.0% of New York energy-goods spending in 2025, against 6.9% in the United States and 4.2% in Texas. Only Vermont (20.5%) and South Dakota (18.3%) had a higher mix.
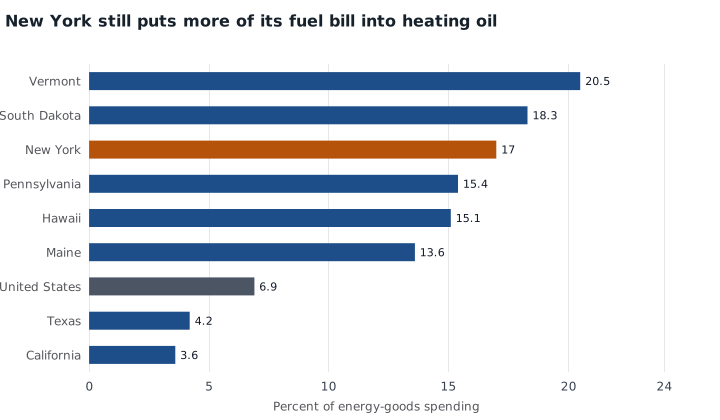
Fuel oil and other fuels as a share of gasoline and other energy goods, 2025. Units: percent of that energy-goods category. The category is household fuels, not diesel bought by trucking firms. New York is highlighted.
In dollars, that leftover heating-oil market is concentrated. New York spent $2.67 billion on fuel oil and other fuels; Pennsylvania spent $2.67 billion. Together they were 18.4% of the U.S. household total of $29.0 billion. If a distillate cargo is docking at New York Harbor in part because the Northeast still burns heating oil, those two state totals are the household evidence.
Even then, New York is not a heating-oil economy in any strong sense. Motor-vehicle fuels, lubricants and fluids were $13.05 billion, 4.9 times the fuel-oil line, and 0.94% of state consumption — half the national motor-fuel share of 1.87%. A diesel shortage still hits New York drivers. It hits Iowa and Texas drivers harder as a share of what they buy.
The 2025 accounts cannot see this autumn's pump price
Energy-goods shares jump when prices jump. They peaked in this series in 2008 and again in 2022, when the U.S. share reached 2.91% and New York's 1.63%. By 2025 both had receded, to 2.01% and 1.13%. New York stayed at the bottom of the ranking through both spikes.
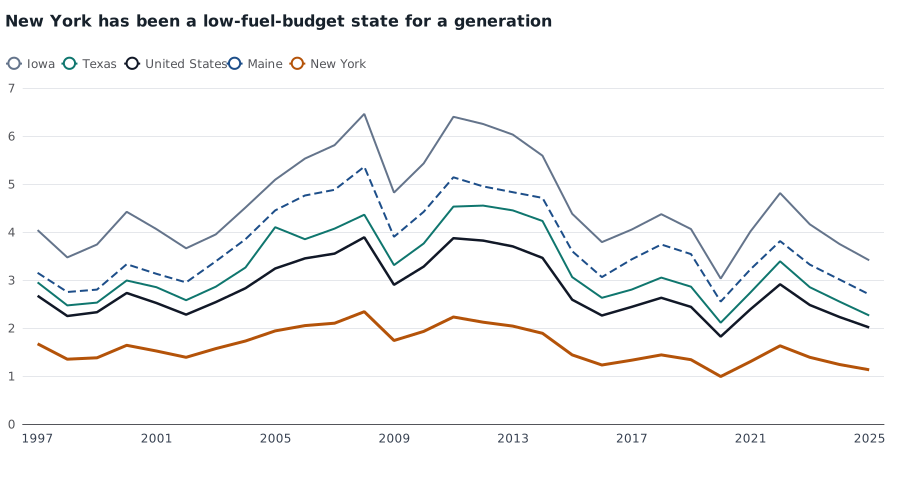
Gasoline and other energy goods as a share of personal consumption expenditures, 1997–2025. Units: percent of total PCE, BEA current-dollar accounts. Shares move with fuel prices as well as quantities; 2020 is the pandemic low.
Those 2025 annual totals close months before the reported September 2026 diesel record and before this tanker sailed. They cannot measure how much a $6.53 gallon will lift 2026 spending, and they cannot say whether New York Harbor is taking the cargo for local heat, for the regional trucking market, or as a stop on a national distillate trade. What they can say is structural: the state that is receiving the ship is not the state whose households devote the largest share of their budget to fuel. That has been true for a generation. If the point of the shipment is to ease American pump prices, the households that put the most of their spending at risk live in places like Iowa, Maine and Texas — not in the city where the tanker is due.
Sources and methods
Household figures are BEA state personal consumption expenditures by type of product, current dollars, annual, 1997–2025, from the 30 September 2026 SAPCE release. Energy goods are line “Gasoline and other energy goods”; the two additive components are “Motor vehicle fuels, lubricants, and fluids” and “Fuel oil and other fuels.” Shares divide those lines by total PCE in the same table. Per-person figures are BEA's published per-capita energy-goods series. Rankings include the District of Columbia (51 areas). New England is BEA's official region, not a custom sum.
The tanker destination and the $6.53 diesel print are from contemporary reporting, not from these accounts, and are not independently verified here. Fuel oil and other fuels is not ultra-low-sulfur diesel, and household PCE excludes commercial truck diesel. Nominal dollars mix price and quantity. SVG charts were rendered from the same calculated shares; they have not been separately checked in a browser layout.
This article is retrospective. It was researched on 24 October 2026 using the pinned 2025 BEA vintage. The news it contextualizes is dated 23 October 2026. Later 2026 prices were not in the annual file.
Research Date
The displayed date matches the related news edition. Research was completed 2026-10-24.
Related news: Daily · 2026-10-23
More Research
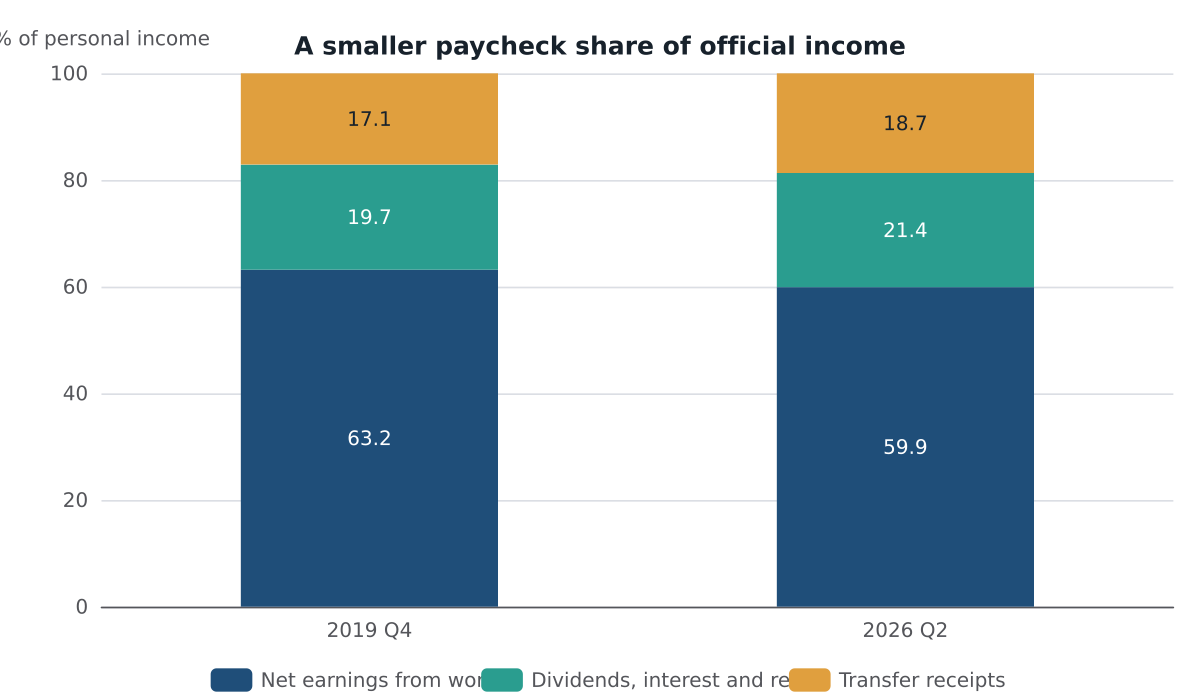
The Paycheck Is A Shrinking Share Of America's Official Income
Work is a smaller slice of U.S. personal income than before the pandemic. Transfers and asset income grew faster than wages.
The First Permanent Nuclear Dump Is In A Small Nuclear Country
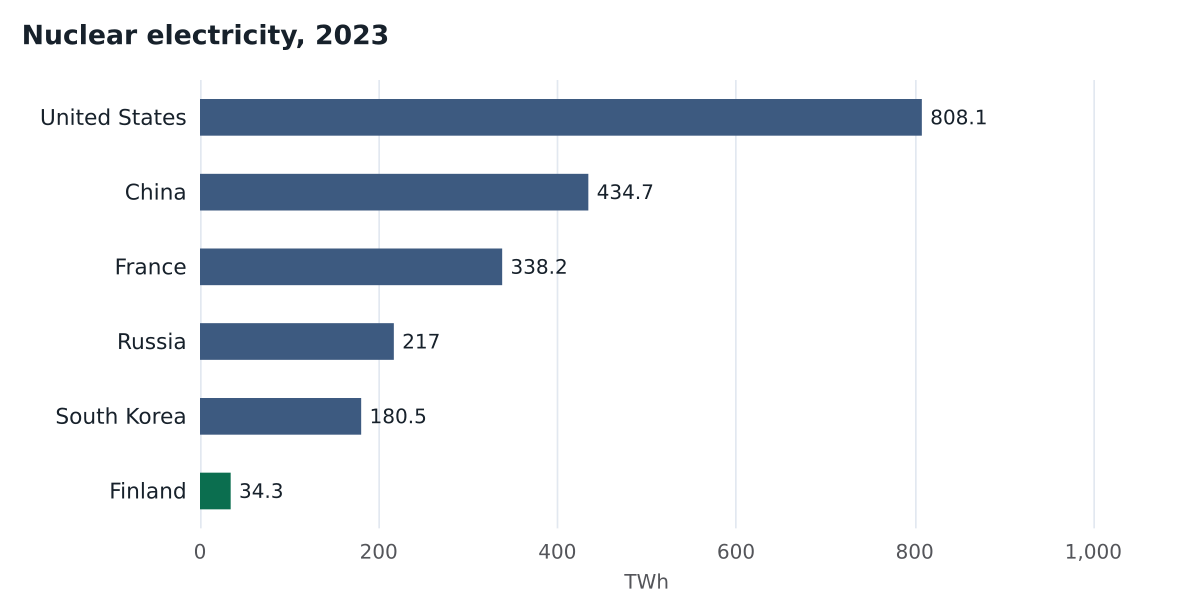
Finland licensed the first permanent high-level nuclear-waste repository. IRENA electricity data show it is a high-share, small-volume nuclear country: 42% of its power, 1.3% of recorded nuc
Georgia Already Builds Cars. Audi Is Joining A Small, Rebuilt Industry.
Georgia’s motor-vehicle industry collapsed in 2009 and came back. Audi’s $4 billion plant is large for that rebuilt, still-small auto state.