LunarWeave
The First Permanent Nuclear Dump Is In A Small Nuclear Country
Finland has licensed the world’s first operating repository for high-level nuclear waste. The underground site at Eurajoki, known as Onkalo, is designed to hold 6,500 tonnes of spent fuel from the country’s five reactors, sealed in copper canisters in bedrock that will remain radioactive for tens of thousands of years, according to reporting on the regulator’s decision.
That sounds like the act of a nuclear giant. It is not. Finland runs a nuclear-intensive grid on a small amount of nuclear electricity. The countries that generate most of the world’s nuclear power — and therefore most of the spent fuel still waiting for a dump — have not opened an equivalent facility.
A high share, a modest pile
In 2023, Finland generated 34,308 gigawatt-hours of nuclear electricity, 42.1% of the 81,541 GWh it produced from all sources (renewable plus non-renewable). Those figures come from the International Renewable Energy Agency’s country electricity statistics. Among the 34 countries with a recorded nuclear-generation figure that year, Finland ranked fifth by nuclear share of electricity — behind France, Slovakia, Ukraine and Hungary — and thirteenth by nuclear volume.
The volume gap is the point. The United States generated 808,076 GWh of nuclear electricity in 2023, 23.6 times Finland’s output, while drawing only 18.2% of its electricity from nuclear plants. China, the second-largest producer, generated 434,720 GWh, 12.7 times Finland, from just 4.6% of its power mix. France is the exception that proves both rules: it produced 338,202 GWh, 9.9 times Finland, and took 64.4% of its electricity from nuclear plants.
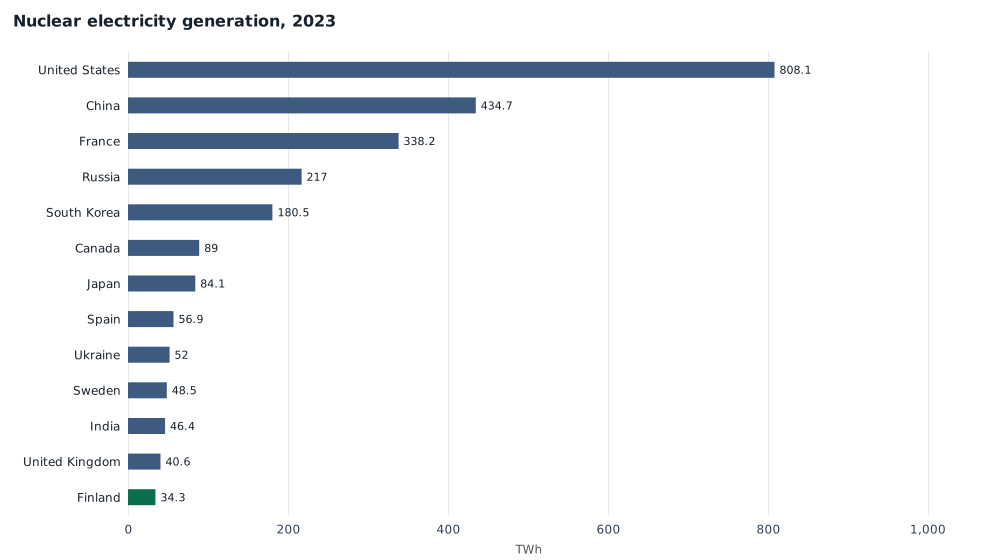
Gross nuclear electricity generation in 2023, terawatt-hours. Finland, which licensed the first permanent high-level waste repository, generated 34.3 TWh — about one twenty-fourth of US output that year. Source: IRENA. Generation is gross output, not spent-fuel mass.
A single American year now outweighs a Finnish generation. The United States produced more nuclear electricity in 2023 than Finland did in the entire 2000–2023 period (567,359 GWh). Cumulative US nuclear generation over those 24 years was 19.7 million GWh, 34.7 times Finland’s; France’s cumulative total was 9.9 million GWh, 17.5 times Finland’s. Those sums are a flow of electricity, not a stock of waste. They still show why a 6,500-tonne repository can be a national solution in Finland and only a rounding error relative to the fuel discharged by the large fleets.
| Country | Nuclear generation, 2023 (GWh) | Share of electricity | Multiple of Finland |
|---|---|---|---|
| United States | 808,076 | 18.2% | 23.6× |
| China | 434,720 | 4.6% | 12.7× |
| France | 338,202 | 64.4% | 9.9× |
| Russia | 217,000 | 18.9% | 6.3× |
| South Korea | 180,494 | 28.6% | 5.3× |
| Finland | 34,308 | 42.1% | 1.0× |
Share of electricity is nuclear generation divided by IRENA’s total renewable plus total non-renewable generation. Russia is IRENA’s Russian Federation.
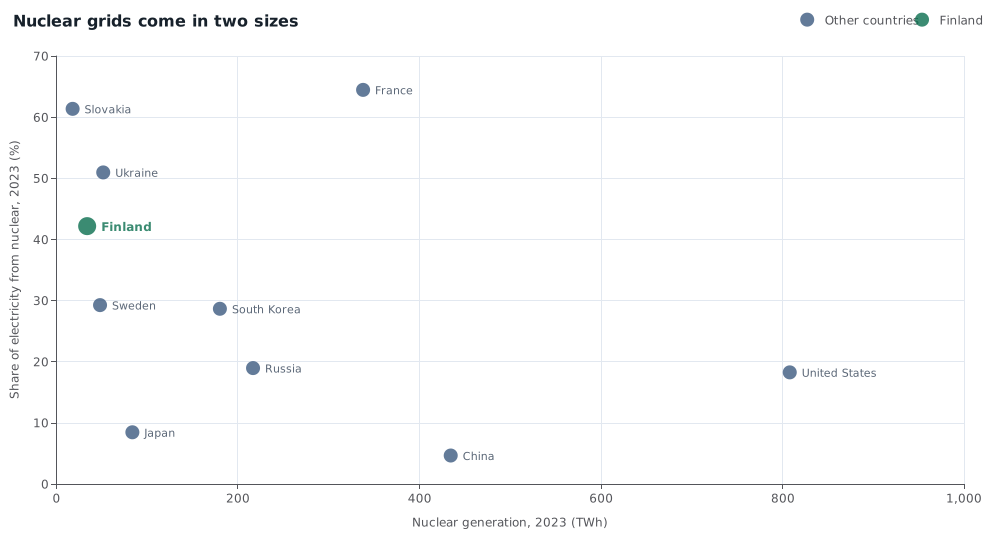
Each point is a country with nuclear generation in 2023. Horizontal axis: nuclear electricity, TWh. Vertical axis: nuclear share of that country’s electricity. Finland sits with other high-share, modest-volume European grids. The United States and China generate far more nuclear electricity at much lower shares. Source: IRENA, 2023.
The 34-country total in this snapshot is 2.73 million GWh of nuclear electricity. Finland accounted for 1.3% of that sum. IRENA does not publish a World nuclear series in the table used here; the sum is the countries that report nuclear generation, not an official global aggregate.
The fifth reactor arrived first
Onkalo is sized for five Finnish reactors. The electricity data show when the fifth unit’s worth of capacity showed up. End-year nuclear capacity in Finland was 2,794 MW in 2022 and 4,394 MW in 2023 — a 1,600 MW increase, the size of a large reactor. Nuclear generation rose from 25,336 GWh (35.1% of electricity) in 2022 to 34,308 GWh (42.1%) in 2023. For the previous decade the nuclear share had stayed near one-third.
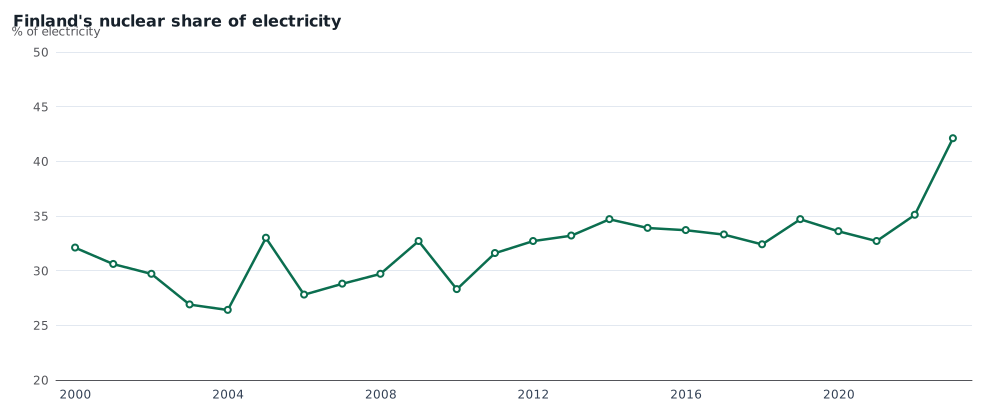
Nuclear electricity as a share of Finland’s total generation (renewable plus non-renewable), 2000–2023. The share hovered near one-third for most of the 2010s, then rose from 35.1% in 2022 to 42.1% in 2023 as installed nuclear capacity increased by 1,600 MW. Source: IRENA. 2024 generation is preliminary and omitted here.
Finland did not wait to add generation until it had a dump, and it did not need a giant fleet to finish the dump. It licensed a permanent repository for a nuclear system that, even after the 2023 expansion, remains a 4.4 GW, 34 TWh producer.
What the figures cannot say
Electricity is not spent fuel. How much uranium a reactor discharges depends on burnup, enrichment, operating hours and reactor type — none of which appear in IRENA’s generation table. Cumulative gigawatt-hours from 2000 through 2023 also omit earlier decades, when the US, French, Russian and Japanese fleets were already running. That omission understates the waste-producing history of the older large programmes more than Finland’s, so it does not flatter the “small country went first” reading; it weakens it.
The data also cannot show whether Onkalo will operate as designed, whether other countries will copy it, or how much of the US or French inventory would fit in a 6,500-tonne cavern. They can show this: the first country to license a permanent high-level repository is a place where nuclear power is a large share of a small system, not the place where most nuclear electricity — and most of the fuel still in pools and dry casks — is produced.
That is why the licence matters beyond Eurajoki. The back end of nuclear power was not solved by the largest producers. It was solved, first, where the pile was small enough for one national project to finish.
Sources and methods
This article is retrospective. The repository licence was reported on 22 October 2026; the electricity figures were compiled later from a pinned IRENA snapshot whose latest complete generation year used here is 2023. IRENA states that 2024 electricity generation is preliminary and not accurate at aggregate levels, so 2024 generation is omitted from the comparisons. Capacity is end-calendar-year net generating capacity; generation is gross output, including on-grid and off-grid plants. Nuclear’s share of electricity is nuclear generation divided by IRENA’s total renewable plus total non-renewable generation, which are mutually exclusive aggregates. Missing observations are not treated as zero. The Onkalo licence, 6,500-tonne design capacity, five-reactor scope and “first in the world” status are taken from contemporary reporting, not from IRENA.
Research Date
The displayed date matches the related news edition. Research was completed 2026-10-23.
Related news: Daily · 2026-10-22
More Research
New York Is Where The Diesel Is Docking. It Is Not Where Households Spend The Most On Fuel.
A diesel cargo bound for New York does not mean New York households spend the most on fuel. In 2025 they ranked 50th of 51 on energy goods as a share of consumption.
Renewables Caught Fossil Fuels On The Capacity Chart. Fossil Plants Still Set The Generation Record.
IRENA world data show renewable capacity overtaking fossil-fuel capacity in 2025 while fossil electricity generation was still at a record.
The Paycheck Is A Shrinking Share Of America's Official Income
Work is a smaller slice of U.S. personal income than before the pandemic. Transfers and asset income grew faster than wages.