LunarWeave
Renewables Caught Fossil Fuels On The Capacity Chart. Fossil Plants Still Set The Generation Record.
When the United Nations Environment Programme told governments that breaching 1.5°C of warming is now imminent, the usual reply was that clean electricity is the easy win: build enough wind and solar, and coal and gas plants will be pushed off the system. Capacity charts make that story look almost finished. Kilowatt-hour charts do not.
In IRENA’s world accounts, renewable generating capacity overtook fossil-fuel capacity at the end of 2025. Fossil-fired generation, though, was already at a record in 2023, and IRENA’s still-preliminary 2024 total is higher again. The power system has added a second grid. It has not retired the first.
The output that climate math has to move
Electricity is not all energy use, and generation is not carbon dioxide: a shift from coal toward gas can cut emissions even while “fossil” kilowatt-hours rise, and this snapshot has no usable world split of coal, oil and gas. What the figures can settle is narrower, and still decisive for any story in which clean power replaces dirty power. Have fossil plants actually been producing less electricity?
They have not. World fossil-fuel generation was 9,943.5 TWh in 2000 and 17,820.9 TWh in 2023 — 79.2% higher. In that 24-year span it fell year-on-year only in 2009, 2019 and 2020. By 2023 it was already above every earlier year in the series, including the 2018 peak that preceded those two dips.
IRENA’s 2024 world generation figures are preliminary and, in the agency’s own footnote, “not accurate at aggregate levels.” They should not be read as a precise last decimal. They do point the same way: 18,001.4 TWh of fossil generation, another high.
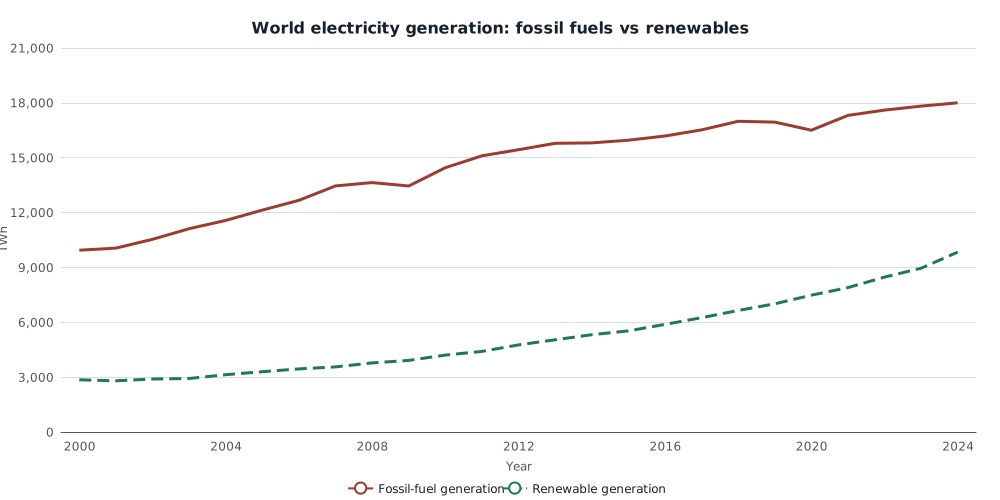
Annual gross electricity generation, world total, terawatt-hours. Fossil fuels (solid) and all renewables (dashed). 2024 is preliminary and not accurate at aggregate levels. Source: IRENASTAT Power Capacity and Generation.
Renewables did grow, fast. Their output rose from 2,854.3 TWh in 2000 (18.4% of electricity) to 8,956.9 TWh in 2023 (30.0%), and a preliminary 9,836.1 TWh in 2024 (31.7%). That is a real industrial transformation. It has not been a substitution.
Total electricity — defined here as IRENA’s total renewable plus total non-renewable generation — went from 15,537.2 TWh in 2000 to a preliminary 30,995.0 TWh in 2024, almost a doubling. Fossil plants kept the larger slice of a much larger pie. Their share of electricity fell only from 64.0% to 59.7% by 2023, and to a preliminary 58.1% in 2024.
The Paris-era record is the same pattern in miniature. From 2015 to 2023, fossil generation rose 11.7%, from 15,959.0 TWh to 17,820.9 TWh, even as its share slipped from 65.8% to 59.7%. A falling share with a rising level is what demand growth looks like when clean power is added on top of the old fleet.
| Year | Fossil generation (TWh) | Renewable generation (TWh) | Fossil share | Renewable share |
|---|---|---|---|---|
| 2000 | 9,943.5 | 2,854.3 | 64.0% | 18.4% |
| 2015 | 15,959.0 | 5,529.5 | 65.8% | 22.8% |
| 2023 | 17,820.9 | 8,956.9 | 59.7% | 30.0% |
| 2024* | 18,001.4 | 9,836.1 | 58.1% | 31.7% |
*2024 generation is preliminary. Shares use renewable plus non-renewable generation as total electricity. Source: IRENASTAT, world aggregate.
Capacity can cross over without output following
The picture that has changed is the stock of plant, not the flow of power. At the end of 2024, world renewable capacity was still just below fossil-fuel capacity: 4,461.6 GW against 4,525.8 GW. At the end of 2025 it was above, 5,155.0 GW against 4,629.7 GW — the first such year in this 2000–2025 series.
That crossover is not the same as “renewables now dominate the grid.” End-2025 renewable capacity was still short of total non-renewable capacity (5,254.8 GW), which folds in nuclear and other non-fossil non-renewables as well as coal, gas and oil. And fossil capacity itself was still being built: 2,244.5 GW at end-2000, 4,629.7 GW at end-2025.
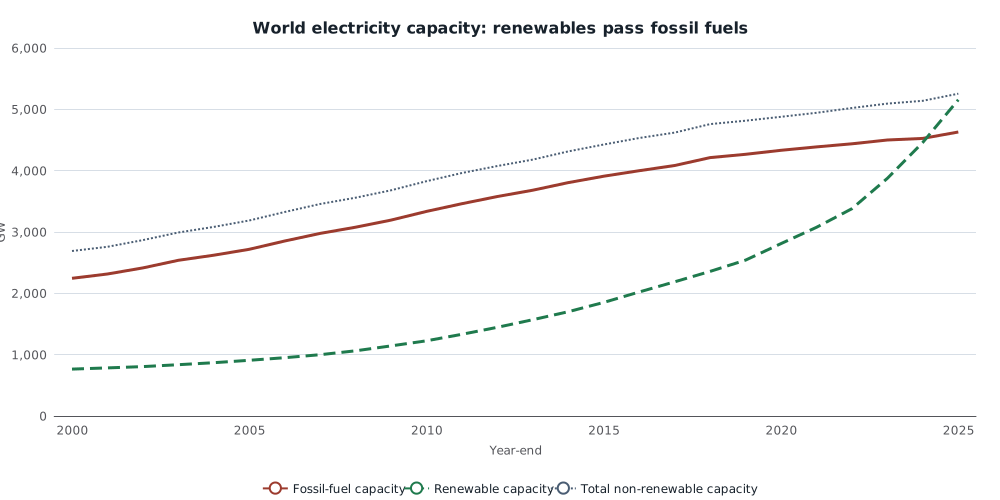
Year-end net generating capacity, world total, gigawatts. Renewable capacity (dashed) first exceeds fossil-fuel capacity (solid) in 2025, but remains below total non-renewable capacity (dotted). Source: IRENASTAT.
Capacity and generation diverge because a gigawatt of solar or wind produces in fewer hours than a gigawatt of coal or gas. IRENA’s generation is also gross output, including electricity that plants consume themselves, while capacity is a year-end net stock — another reason not to treat the two series as a plant-level capacity factor. The qualitative point does not depend on that conversion: the world can install more renewable megawatts than fossil megawatts and still take most of its electricity from fossil fuels.
Inside the renewable total, the mix is shifting. In the preliminary 2024 figures, hydropower was 4,472.4 TWh, 45.5% of renewable generation; wind was 2,499.3 TWh and solar 2,105.8 TWh. Wind and solar together have caught hydro. They have not caught fossil fuels.
Added, not yet instead
Even the latest year, treated cautiously, shows addition rather than replacement. Between 2023 and preliminary 2024, total electricity rose 1,164.0 TWh. Renewables supplied 879.2 TWh of that extra output. Fossil generation still rose 180.5 TWh. Clean power covered most of the growth. It did not cover enough of it to turn fossil output down.
That is the tension in the week’s UN warning, not a proof of it. UNEP’s Emissions Gap findings, as reported by CNN, O Globo and others, are about all greenhouse gases and all sectors. Electricity is only one of them, and among the easier to clean. If fossil kilowatt-hours in this relatively tractable sector were still setting records in 2023 — and still rising in IRENA’s preliminary 2024 world total — a 1.5°C overshoot does not require a mysterious failure somewhere else. It is what a larger grid with a still-dominant fossil fleet produces.
The same numbers also bound the opposite error. Renewables are not a rounding error, and the fossil share is no longer stuck at two-thirds. The missing piece is not whether the new plants exist. It is whether the old ones run less.
Sources and methods
Figures are IRENASTAT world aggregates of annual gross electricity generation (gigawatt-hours, converted to terawatt-hours) and year-end net generating capacity (megawatts, converted to gigawatts). Total electricity is total renewable plus total non-renewable generation. Fossil fuels are a subset of non-renewable plant. World coal, gas, oil and nuclear generation series were not available for this geography in the pinned snapshot, so the fossil total is not broken down by fuel, and the non-fossil slice of non-renewable output is not labelled as nuclear.
This is retrospective research. The news day is 21 October 2026; the calculations use a 8 October 2026 IRENA snapshot whose latest generation year is 2024 and latest capacity year is 2025. IRENA states that 2024 generation is preliminary and not accurate at aggregate levels. The 1.5°C and 2.6°C statements are contemporaneous reporting of UNEP’s Emissions Gap report, not an independent reading of that report. Charts were rendered to SVG; they were not separately checked in a browser or on a phone.
Research Date
The displayed date matches the related news edition. Research was completed 2026-10-22.
Related news: Daily · 2026-10-21
More Research
The First Permanent Nuclear Dump Is In A Small Nuclear Country
Finland licensed the first permanent high-level nuclear-waste repository. IRENA electricity data show it is a high-share, small-volume nuclear country: 42% of its power, 1.3% of recorded nuc
$110 Oil Is A Power-Bill Shock In Only A Few Grids
IRENA accounts show oil-fired electricity falling to 2.4 percent of world generation by 2023, with the remaining kilowatt-hours concentrated in Saudi Arabia, Iraq, Kuwait and Iran.
New York Is Where The Diesel Is Docking. It Is Not Where Households Spend The Most On Fuel.
A diesel cargo bound for New York does not mean New York households spend the most on fuel. In 2025 they ranked 50th of 51 on energy goods as a share of consumption.