LunarWeave
Oil's Speed Problem: What 46 Years Of Brent Data Say About The $120 Shock
On 16 September 2026, European utilities and refiners learned that some of their Saudi crude is not coming — at least not soon. Satellite imagery showed severe damage to the 1,200-kilometre pipeline that carries Saudi oil from the Gulf coast to the Red Sea, with repairs expected to take more than a month (Adevărul, citing BBC Verify). Riyadh told European buyers some shipments are cancelled and Red Sea loading is suspended (Slovenian Press Agency, citing Reuters), big customers began hunting for replacement barrels, and oil prices broke above $120 a barrel (Večernji list). The move lands on a world where the US Federal Reserve has just raised rates for the first time since 2023, calling inflation "too high for too long" (Financial Times).
Headlines calling $120 a record are easy to find. Whether the price really is unprecedented — and how much damage it is likely to do — depends on a distinction most coverage skips: the difference between the level of oil prices and their speed. Nearly half a century of annual Brent data, preserved in the International Monetary Fund's World Economic Outlook database, suggests this shock is historically ordinary in level, close to extraordinary in speed, and arriving into an economy that was already expected to slow.
A record — but only in nominal terms
In current dollars, the reported $120 spot price does exceed anything in the modern record. Annual-average Brent has never topped $112 — that was 2012, during the Arab Spring and its aftermath. Only three years in the 46-year series (2011–2013) averaged $100 or more.
But current dollars flatter the comparison. Adjusted for US consumer-price inflation, the picture inverts: Brent averaged about $148 in today's money through 1980's second oil shock, $146 in 2008, and a remarkable $160 in 2011–2012, the era of the Arab Spring, Libya's collapse and sanctions on Iran. In real terms, eight years since 1980 — not three — saw annual averages above what $120 means in 2025 dollars today. Consumers who remember filling up in 2012 have, in purchasing-power terms, paid more than this "record" for roughly three consecutive years.
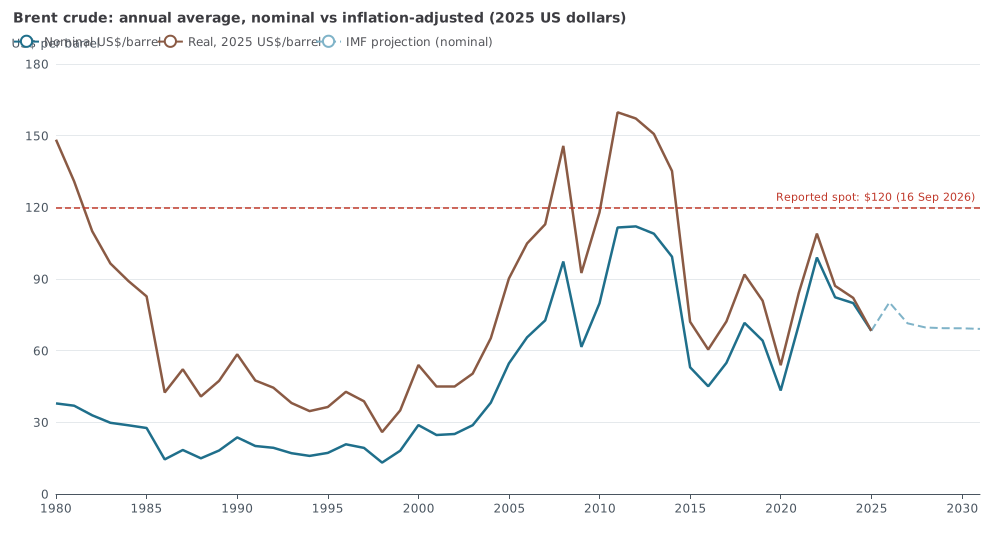
If the level is not unprecedented, what made 16 September feel like a rupture? The speed. Brent averaged $68.32 in 2025. A price near $120 represents a jump of about 76% from that average — larger than any full-year increase in the annual record, including 2021's pandemic-rebound surge (+63%) and 2000's dot-era spike (+59%).
The annual average that eventually lands in the statistics depends on how long the spike persists. If the reported price held for a quarter of 2026 and the IMF's baseline described the rest, 2026 would average about $90; half the year, about $100; three-quarters, about $110. Even the most conservative of those scenarios puts the year 12% above what the IMF assumed — and sustained $120 for most of the year would write history's fastest annual oil-price jump into the books. Annual averages smooth intraday panic, but they also record it.
What followed past spikes
Does a fast oil shock actually break the world economy? History offers a descriptive — not causal — answer in the ten years since 1980 when annual-average Brent jumped by 30% or more: 1990, 1999, 2000, 2004, 2005, 2008, 2011, 2018, 2021 and 2022.
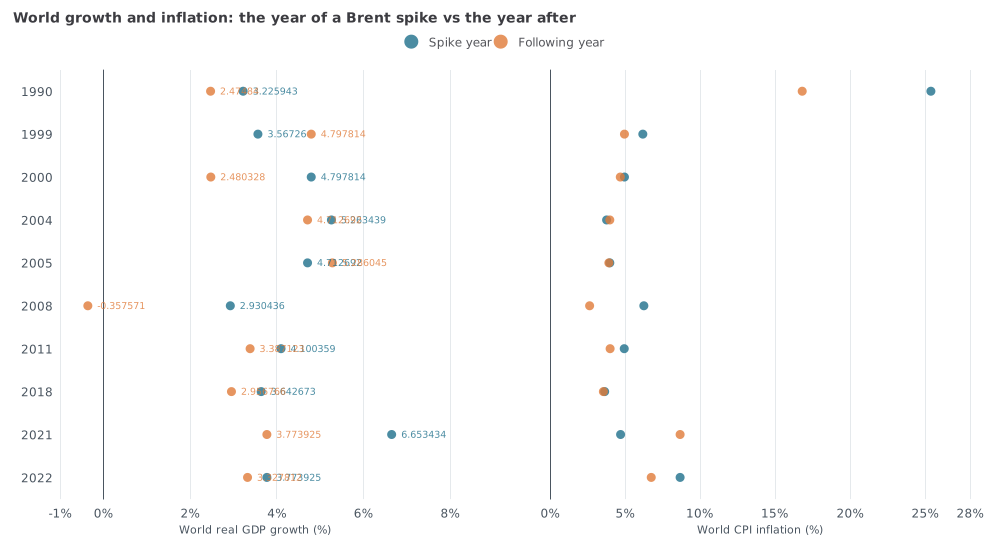
In eight of the ten following years, world GDP growth slowed, by a median of 0.7 percentage points. That is a real cost — applied to 2025's 3.4% world growth, a median-size hit would pull it toward 2.7% — but it is a brake, not automatically a collapse. Recessions followed the 2008 spike (2009, with the financial crisis doing most of the damage) and the 2000 spike (the dot-com slowdown of 2001), while the jumps of 1999, 2004 and 2005 passed with little or no slowdown.
Inflation is where the record is more reassuring than current anxiety suggests. World consumer-price inflation fell in eight of the ten years after a spike, and the median change was −0.6 points. Oil spikes usually mark the peak of a price disturbance that then fades, not the start of a wage-price spiral. The great exception is the one everyone remembers: after 2021's jump, world inflation rose four points to 8.7% in 2022 — because that oil shock rode on top of a broad, economy-wide post-pandemic inflation that had nothing to do with crude.
| Spike year | Brent avg (US$) | Jump | World growth, t→t+1 (pp) | World inflation, t→t+1 (pp) |
|---|---|---|---|---|
| 1990 | 23.7 | +30% | −0.75 | −8.58 |
| 1999 | 18.1 | +38% | +1.23 | −1.22 |
| 2000 | 28.8 | +59% | −2.32 | −0.28 |
| 2004 | 38.2 | +33% | −0.55 | +0.21 |
| 2005 | 54.7 | +43% | +0.57 | −0.06 |
| 2008 | 97.3 | +34% | −3.29 | −3.62 |
| 2011 | 111.5 | +40% | −0.71 | −0.94 |
| 2018 | 71.6 | +31% | −0.69 | −0.09 |
| 2021 | 70.8 | +63% | −2.88 | +3.97 |
| 2022 | 99.0 | +40% | −0.45 | −1.92 |
These episodes are confounded by wars, financial crises and a pandemic; the world-average inflation of the early 1990s is dominated by developing-country episodes rather than anything like today's advanced-economy conditions. History cannot say what this shock will do. It can say what past shocks of similar speed were followed by — and why 2021's outcome, the one policymakers fear, was the outlier rather than the rule.
A shock the baseline had no room for
The most consequential number may be one nobody quoted in the day's coverage: $80.19. That is the average Brent price for 2026 assumed in the most recent IMF World Economic Outlook vintage — compiled before the pipeline attack — which projected prices easing back to $71 next year. The reported spot sits about 50% above that assumption. The same baseline already had world growth slowing from 3.4% to 3.1% in 2026 and world inflation rising from 4.1% to 4.4%. There was no cushion: the Fund's projection was for a soft landing at moderate prices, not a supply shock.
That is what makes this episode a test of which historical pattern applies. If $120 proves brief — a month of repairs, rerouted cargoes, the ship-to-ship transfers Saudi Arabia is already arranging through Oman's Suhar port (Novinky, citing Reuters) — then 2026 joins the majority of historical spikes: a growth brake, an inflation scare that fades, and a nominal "record" that dissolves under inflation adjustment. If the blockade of the Red Sea and Hormuz routes keeps supply physically severed for most of the year, the annual data will record something only the pandemic rebound has approached — a speed shock the world economy, already slowing and already inflationary, absorbs from a standing start.
Methods and sources
Retrospective note. This article was researched on 17 September 2026 (UTC) about a 16 September 2026 digest of same-day reporting; it is a retrospective analysis, not a real-time account. All price and macro series come from a pinned snapshot of the IMF World Economic Outlook database (April 2026 WEO vintage, normalized in a 24 August 2026 snapshot): Brent spot price, annual average, US$ per barrel (series POILBRE); world average consumer-price inflation, % change (PCPIPCH); world real GDP growth, % change (NGDP_RPCH); and the US consumer-price index used for deflation (PCPI). Values through 2025 are observed or estimated; 2026–2031 values are IMF baseline projections from before the pipeline attack and are used only as the "baseline" scenario, never as forecasts made on the digest date. Real prices are deflated to 2025 US dollars using the same snapshot's US CPI; the 2025-dollar value of the reported $120 spot ($116) uses the projected 2026 CPI. The $120 figure itself is a single-day spot price reported by news outlets, not an IMF observation, and is used only in clearly labelled scenario calculations. "Spike years" are years with a 30%+ year-on-year jump in annual-average Brent; episode aftermaths are descriptive historical associations, confounded by concurrent crises, and establish no causal effect. World aggregates weight all member economies. Calculations are reproducible from the workspace's analysis/calculate.py and saved data extracts. A MacroVedia data page presents the same world inflation series for exploration; official attribution remains the IMF.
Research Date
The displayed date matches the related news edition. Research was completed 2026-09-17.
Related news: Daily · 2026-09-16
More Research
The AI Boom Is Real. The Software-Jobs Boom Isn't.
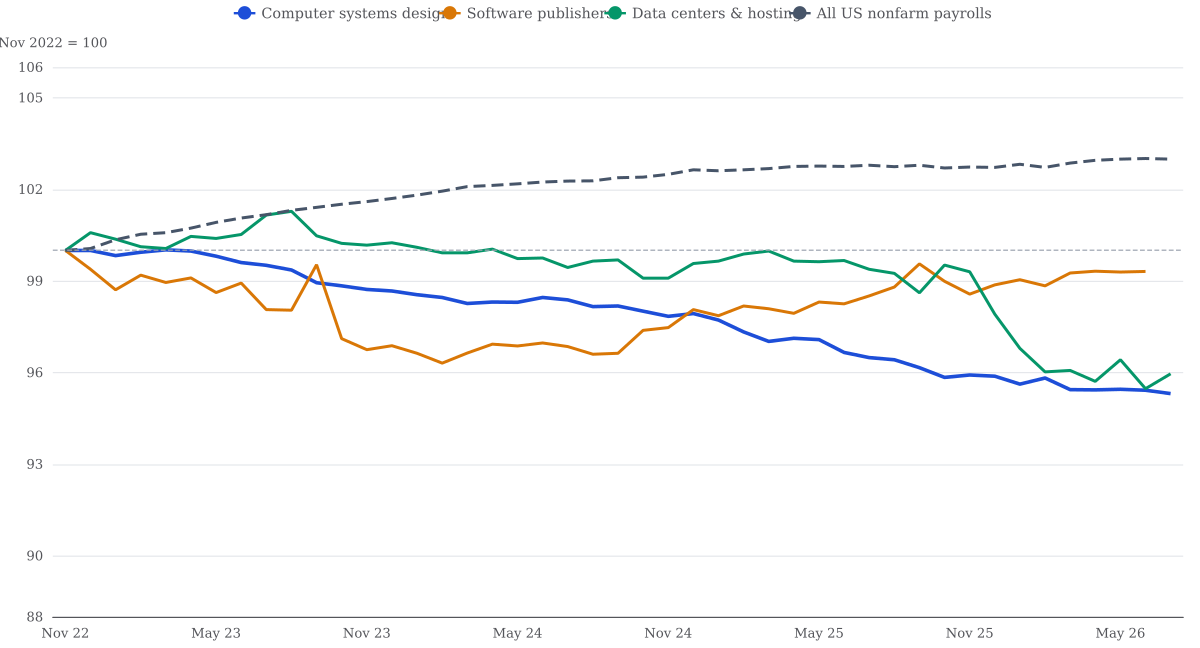
US payroll data show software employment has shrunk since ChatGPT's launch even as AI valuations and spending boom: 113,700 fewer computer-systems-design jobs, information-sector employment
The Border Surge Ended. Florida's Detention Boom Had A Different Engine
When the Department of Homeland Security's inspector general reported this month that detainees at the now-closed "Alligator Alcatraz" centre in Florida had been held in…
Trucking Jobs Are Below 2019. The Rest Of The U.S. Job Market Is Not.
U.S. truck transportation payrolls peaked in 2022 and were still below July 2019 in July 2026, even as total nonfarm jobs grew — the starting point for a reported diesel-margin spike.