LunarWeave
The Border Surge Ended. Florida's Detention Boom Had A Different Engine
When the Department of Homeland Security's inspector general reported this month that detainees at the now-closed "Alligator Alcatraz" centre in Florida had been held in metal cages the size of telephone booths — up to two hours at a time, in a facility inspectors said violated basic standards for hygiene, medical care, food and safety — it described the conditions inside one corner of a fast-growing detention system. It did not answer the question that decides what those conditions mean: who, exactly, was being funnelled into Florida's immigration enforcement pipeline?
The instinctive assumption is that detention capacity tracks the border. By that logic, Florida's build-out should have been processing people from a southern border wave. The official numbers say something else. The wave was already over when Florida's enforcement curve turned sharply upward — and the people Border Patrol began encountering in Florida look nothing like the wave that preceded it.
The southern border wave ended in early 2025
U.S. Customs and Border Protection's monthly encounter data show how abruptly the era of mass arrival ended. In December 2023, CBP recorded 315,443 Title 8 encounters in the southwest land border region — Border Patrol apprehensions between ports plus port-of-entry inadmissibles. By February 2025 the figure was 11,710 — a 96 percent collapse in fourteen months. It never came back: from February 2025 through July 2026, the monthly count stayed in a band of roughly 8,000 to 14,000, and the twelve months to July 2026 (137,140 encounters) ran 79 percent below the preceding twelve (645,212). Whatever else America's immigration debate is about now, it is not about a surge of new arrivals at the southwest border.
Florida's curve points the other way
The Border Patrol's Miami Sector — the agency's Florida area of responsibility — moved in the opposite direction at almost exactly the same time. From October 2023 through March 2025, the sector logged a modest 143 encounters per month on average. In April 2025 the series jumped to 727, and from June 2025 onward it averaged just over 1,000 per month. July 2026, at 1,202 encounters, was the highest month in the published series. The latest twelve months (August 2025–July 2026) total 12,163 encounters — two and a half times the prior twelve months (4,897) and more than eight times the fiscal-2024 total (1,482).
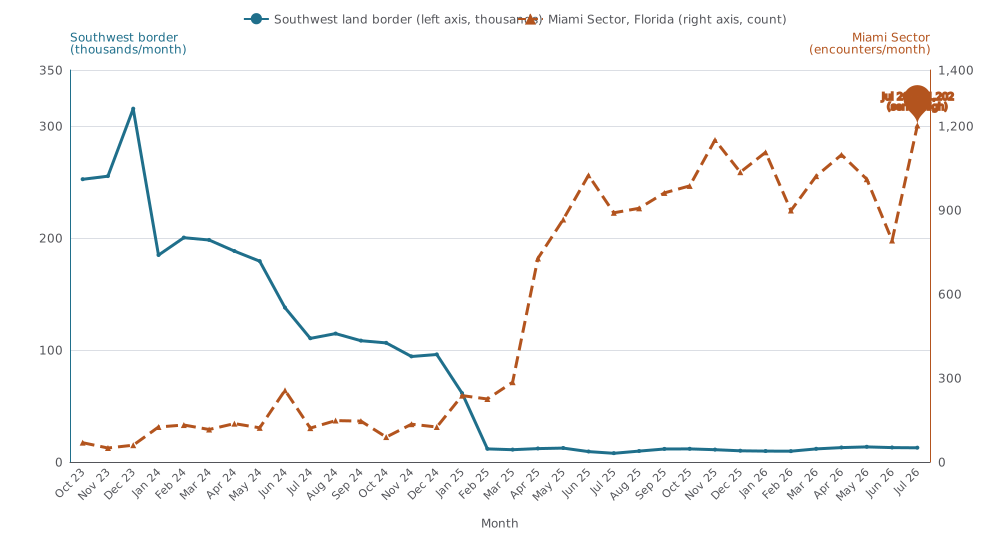
Two curves, two directions: the southwest border (left axis) fell from above 300,000 encounters a month to a low five-digit plateau, while Miami Sector (right axis) climbed from obscurity to a sustained four-digit monthly flow.
Not the flows Florida was known for
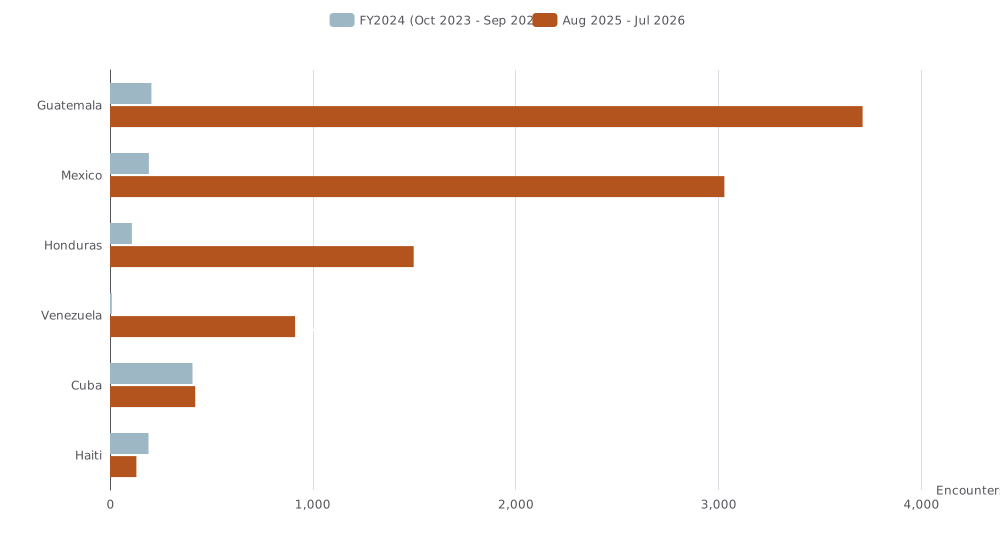
The composition of that jump is the most telling detail. The classic Florida migration corridor is Cuban and Haitian: maritime arrivals, parole requests, port processing. In the latest twelve months, Cubans and Haitians together account for just 550 Miami Sector encounters — 4.5 percent of the sector's total. The port-and-airport side of the ledger collapsed even harder than the border: Miami Field Office encounters fell from 26,975 in November 2023 to 1,120 in July 2026.
Instead, the sector's encounters are now dominated by single adults from Guatemala (3,712 in the twelve months to July 2026), Mexico (3,030) and Honduras (1,498), with Venezuelans (913) behind them. Single adults made up 98.6 percent of the sector's encounters over that window. In fiscal 2024 the same sector recorded 204 Guatemalan and 192 Mexican encounters; Cuba (407) and Haiti (190) were comparable contributors then.
Florida has no land border with Mexico. Single adults from Guatemala, Mexico and Honduras do not wade ashore in the sector; they are, overwhelmingly, people already inside the United States whom Border Patrol apprehends in Florida — at checkpoints, in operations with state and local agencies, in the interior enforcement surge that expanded through 2025 and 2026. The encounter data cannot show where each person originally entered the country, and CBP does not publish how many were held at any specific facility. What it does show is the timing: the sector's flow roughly tenfolded from April 2025 and stayed at about 1,000 encounters a month through July 2026, the period in which Florida's detention infrastructure, including the Everglades site inspectors have now catalogued, was in operation.
A homegrown pipeline, not a border wave
Put together, the numbers reframe what the inspector general's report describes. Florida's detention build-out was not the tail end of the 2023–24 border wave — that wave had already shrunk by 96 percent before Miami Sector's numbers took off. It coincided with an enforcement-driven increase in encounters inside Florida itself: a sustained catch-and-detain tempo applied to a population of mostly Central American single adults already present in the state, while the traditional Cuban and Haitian corridor dwindled to a trace.
That distinction matters for how the cage findings are read. Conditions at a temporary facility are one scandal; the scale and origin of the pipeline feeding it are a separate policy choice with its own arithmetic. On the evidence of CBP's own monthly counts, that pipeline was built during — not despite — the quietest southern border in years.
Encounters are administrative events, not distinct people: one person apprehended twice counts twice, and monthly counts are not adjusted for repeat crossings. The Miami Sector figures cover Border Patrol's Florida area of responsibility under Title 8 authority in the coastal ("Other") region; port and airport processing appears separately under field offices. The data used here run through July 2026, the latest month in CBP's July 2026 public release.
Sources and methods. Encounter counts are from CBP's Nationwide Encounters public data (July 2026 release, monthly through July 2026), retrieved from the CBP public data portal. Region totals sum the citizenship-and-demographic categories CBP publishes across areas of responsibility; single-adult and nationality extracts for the Miami Sector were cross-checked against the published series. Reporting on the inspector general's findings: BBC and El Comercio. This is a retrospective analysis prepared on 15 September 2026 of a digest dated 14 September 2026, using the data snapshot available at research time; it does not imply these figures were published on the digest date.
Research Date
The displayed date matches the related news edition. Research was completed 2026-09-15.
Related news: Daily · 2026-09-14
More Research
Trucking Jobs Are Below 2019. The Rest Of The U.S. Job Market Is Not.
U.S. truck transportation payrolls peaked in 2022 and were still below July 2019 in July 2026, even as total nonfarm jobs grew — the starting point for a reported diesel-margin spike.
The American Workweek Already Left 40 Hours. It Has Not Reached 32.
U.S. private payrolls already average 34.3 hours a week. A 32-hour bill would still cut factories, mines and trucks, not a four-day national norm.
The Last Time Japan’s Policy Rate Was 1.25%, Prices Were Falling
The Bank of Japan’s reported 1.25% policy rate was last seen in 1995, when consumer prices were falling. IMF accounts show 2025 inflation at 3.2% after a 2024 contraction.