LunarWeave
Iran’s New Leader Inherits The Worst Slump Since The Iran-Iraq War
Ali Khamenei’s funeral began in Tehran on 3 July 2026 as a six-day display of mourning and state power, the route planned from the capital through the shrine cities of Iraq before burial in Mashhad. The Guardian described the ceremonies as an exercise in defiance as well as grief. The supreme leader had been killed in US-Israeli strikes in February. His son and successor, Mojtaba Khamenei, stayed away from the early rites.
The political inheritance is obvious. The economic one is easier to miss in a week of processions. In the IMF’s World Economic Outlook, Iran’s real GDP is estimated to contract 6.1 percent in 2026. That is not another grinding sanctions year. It is the steepest calendar-year fall since 1988, the last year of the Iran-Iraq war.
The 2026 figure is an IMF staff estimate in an August 2026 snapshot, not a final outturn. It still answers a concrete question: relative to the slumps Iranians already know, how deep is the hole the new leadership is being asked to govern?
Worse than the 2010s, and it started before the strike
Iran’s post-revolution growth record is scarred by war and sanctions. Real output fell 21.6 percent in 1980 and 9.8 percent in 1986. Against that wartime history, 2026 is not unique. Against everything since the ceasefire with Iraq, it is.
The 2012 sanctions contraction was 3.7 percent. The first year of the 2018 reimposition of US sanctions was also 3.7 percent, followed by 2.4 percent in 2019. The IMF’s 2026 estimate is about 2.3 percentage points worse than either of those single years.
It is also not a one-year shock. Real GDP already shrank an estimated 1.5 percent in 2025, before the February 2026 strikes. Compounded, 2025–26 take 7.5 percent off the 2024 level of constant-price GDP. The two-year 2018–19 sanctions episode took 6.0 percent off; 2012–13 took 5.2 percent. Real GDP per person, on the IMF’s constant-price series, falls further still: 9.3 percent between 2024 and 2026.
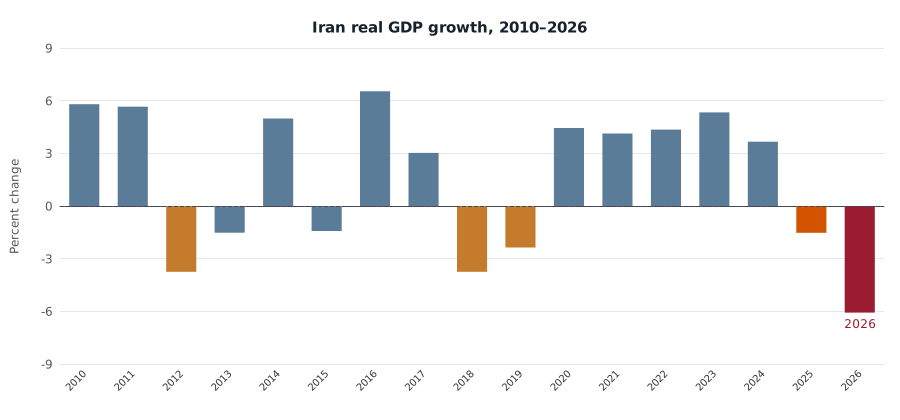
Annual percent change in Iran’s real GDP (constant prices), 2010–2026. Orange bars mark the 2012 and 2018–19 sanctions contractions; the dark red bar is the IMF’s 2026 estimate (−6.1%). 2025–26 are IMF staff estimates in an August 2026 World Economic Outlook snapshot, not final outturns. Source: IMF World Economic Outlook, series NGDP_RPCH.
The long history makes the same point without treating 2026 as a rerun of the 1980s. After the Iran-Iraq war, no calendar year in this series is worse than 2026.
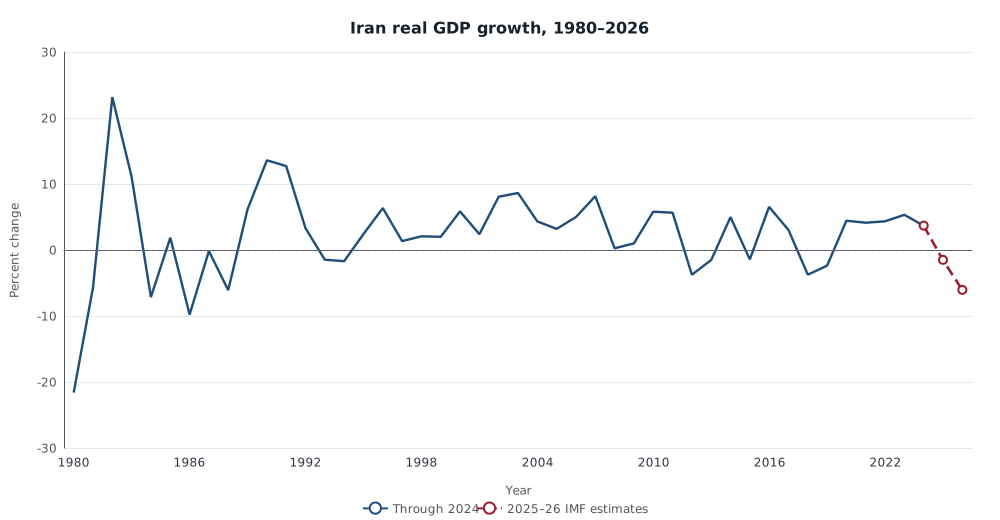
Annual percent change in Iran’s real GDP, 1980–2026. The solid line runs through 2024; the dashed segment is the IMF’s 2025–26 estimate. Source: IMF World Economic Outlook, series NGDP_RPCH. Readers choosing Iran on the MacroVedia GDP-growth page will see the same measure.
None of this identifies a single cause. A war that killed the supreme leader, damaged oil and logistics, and froze diplomacy would be expected to show up in 2026. The 2025 decline shows the economy was already shrinking before that strike. The IMF series cannot split those layers, and it cannot say what 2026 would have looked like without the war.
Prices are running faster than in any year on this record
Output is the smaller part of the inheritance. Average consumer-price inflation is estimated at 68.9 percent in 2026, after 50.9 percent in 2025 and 32.5 percent in 2024. In the 1980–2026 World Economic Outlook series for Iran, 2026 is the highest inflation year. The previous peaks were 2025 itself and 1995 (49.3 percent). The 2012 and 2018 sanctions years, harsh as they were, had inflation of 29.3 and 26.9 percent.
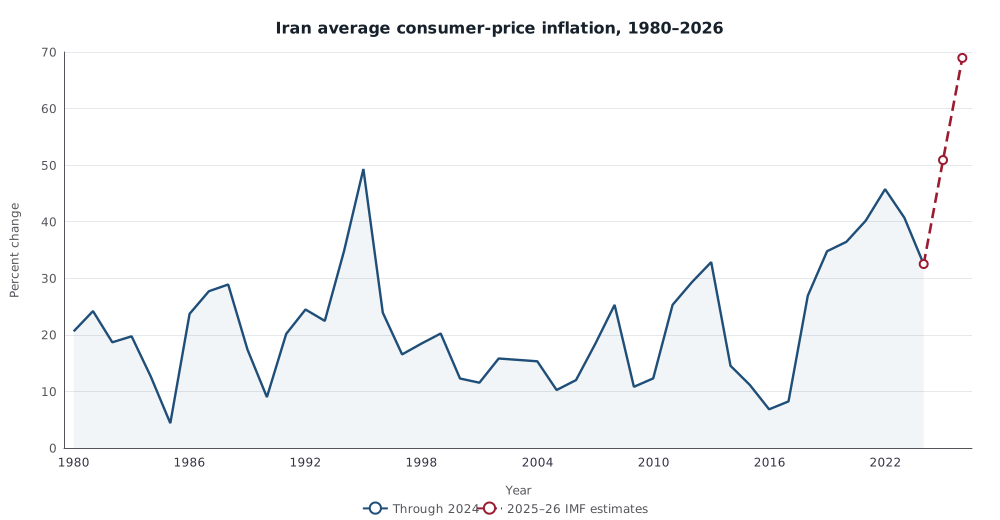
Annual percent change in average consumer prices, 1980–2026. The 2026 IMF estimate of 68.9 percent is the highest reading in this series. 2025–26 are estimates. Source: IMF World Economic Outlook, series PCPIPCH.
High inflation and falling real output together mean households are not merely poorer in volume terms. The price level is jumping while the economy shrinks. That combination is harsher than the 2010s pattern, when contractions were smaller and inflation, though already high, stayed well below the 2025–26 estimates.
Trade volumes look like a sanctions year; the external surplus does not
Export volumes tell a more familiar story. The IMF estimates a 20.3 percent drop in the volume of goods and services exports in 2026, after an 11.6 percent rise in 2024 and a 1.1 percent dip in 2025. Goods exports alone are estimated down 21.4 percent. Those 2026 declines sit next to 2013 (−19.8 percent) and 2019 (−19.6 percent). In trade volumes, 2026 looks like a severe sanctions year, not something off the historical chart.
What is different is the current-account swing. The surplus was 3.2 percent of GDP in 2024 and 0.6 percent in 2025. The 2026 estimate is a 1.8 percent of GDP deficit — the figure is stored that way in the IMF file, already rounded. A country that had been earning more than it spent on the rest of the world is, on this estimate, no longer doing so in the year of the succession.
Dollar GDP is a noisier companion. Converted at market rates, the IMF’s current-price dollar GDP falls from $417 billion in 2024 to $300 billion in 2026, about 28 percent. That drop mixes real contraction, inflation, and the exchange rate; it is not a 28 percent fall in living standards. The constant-price path — down 7.5 percent over two years, 9.3 percent per person — is the cleaner volume measure.
| Year | Real GDP, % change | Average CPI inflation, % | Export volume, % change |
|---|---|---|---|
| 2012 | −3.7 | 29.3 | −2.2 |
| 2018 | −3.7 | 26.9 | −15.0 |
| 2019 | −2.4 | 34.8 | −19.6 |
| 2024 | 3.7 | 32.5 | 11.6 |
| 2025 (est.) | −1.5 | 50.9 | −1.1 |
| 2026 (est.) | −6.1 | 68.9 | −20.3 |
Iran, IMF World Economic Outlook. 2025–26 are staff estimates in the August 2026 snapshot. Export volume is goods and services.
What the funeral cannot conceal
The ceremonies in Tehran are meant to show continuity. The IMF numbers, taken on their own terms, show a succession arriving in a worse macroeconomic year than the sanctions recessions of 2012 and 2018–19: a deeper real contraction, a two-year slide that began before the February strikes, inflation at a record for this dataset, and an external surplus that has flipped to a deficit.
That is the inheritance. It is not a forecast of political collapse, and it is not proof that the assassination caused every lost percentage point. It is the scale of the hole, measured the same way the IMF measured the last two sanctions slumps. On that comparison, 2026 is worse.
Sources and methods
Figures are from the IMF World Economic Outlook database (Iran, ISO code IRN), using the catalogue snapshot dated 24 August 2026. Real GDP growth is series NGDP_RPCH; inflation is average consumer prices, PCPIPCH; export volume is TX_RPCH (goods only: TXG_RPCH); the current-account ratio is BCA_NGDPD; constant-price GDP and GDP per capita are NGDP_R and NGDPRPC; current-price dollar GDP is NGDPD. Annual observations are dated 1 January of each year. Two-year changes compound the annual growth rates and match the constant-price GDP index. Years through 2024 are treated as historical estimates; 2025–26 are IMF staff estimates/projections and may be revised. Iran’s official statistics are often incomplete, so even earlier years in the WEO are staff estimates. The series do not isolate the February 2026 strikes from sanctions, oil-market moves, or other shocks.
This is retrospective research written on 10 September 2026 about events reported on 3 July 2026. The pinned WEO snapshot is later than that news day and can include staff revisions that were not in circulation then. It is not an attempt to reconstruct what was knowable in early July. MacroVedia pages linked above are the same IMF series; choose Iran in the geography selector. They are not a substitute for the IMF source, and live vintages can drift from the snapshot used here.
Research Date
The displayed date matches the related news edition. Research was completed 2026-09-10.
Related news: Daily · 2026-07-03
More Research
Germany’s Economy Is No Larger Than It Was In 2019
IMF growth rates show Germany uniquely contracted in 2023 and 2024, leaving real GDP essentially where it was in 2019.
The Rest Of The U.S. Job Market Has Been Shrinking
Later BLS payroll data show June 2026’s job gain shrinking to 20,000, with health care and social assistance more than accounting for it, while the rest of U.S. payrolls have been declining
The United States Is Still Larger Than China In Dollars. Its Budget Deficit Is The Outlier.
IMF accounts show the US–China dollar-GDP gap widened after 2019, while the United States ran the largest general-government deficit among large economies in 2024.