LunarWeave
The Rest Of The U.S. Job Market Has Been Shrinking
When the June 2026 employment report landed, the argument split in two. The payroll total still showed a gain. A Center for Economic and Policy Research recap put that gain at 57,000 jobs and warned that almost all of it came from health care and social assistance. Household-survey readers pointed to a falling employment-to-population ratio. The more stubborn question sits inside the payroll survey itself: has the United States stopped adding jobs outside a handful of care industries?
In the later Current Employment Statistics vintage used here — a Bureau of Labor Statistics snapshot taken on 24 August 2026 — June’s total nonfarm gain is 20,000 jobs, not 57,000. Health care and social assistance added 41,000. Every other payroll job, taken together, fell by 21,000. That is not a rounding story. It is a market in which a sector that employs 15 percent of payroll workers more than accounted for the entire net increase.
July then turned down. Total nonfarm employment fell by 23,000 jobs, a preliminary figure in this snapshot. Care industries still added 22,600; the rest of the establishment survey lost 45,600. June was not a one-month oddity. It was a loud month in a quieter, longer narrowing.
June’s gain lived in care work
Seasonally adjusted nonfarm payrolls stood at 158.881 million in June 2026. Of those jobs, 23.890 million were in health care and social assistance — hospitals, clinics, nursing care, and related social services (NAICS 62). That industry added 20,300 jobs in June; social assistance added 20,700. Together they are the 41,000-job increase above.
The largest offset was leisure and hospitality, which shed 43,000 jobs. Inside that supersector, food services and drinking places lost 12,100 and accommodation lost 21,400, so the CEPR note that hotels and restaurants lost jobs holds in this vintage. Information, transportation and warehousing, and government also declined. Professional and business services still added 34,000, including 11,000 in temporary help, so June was not a uniform collapse. It was lopsided.
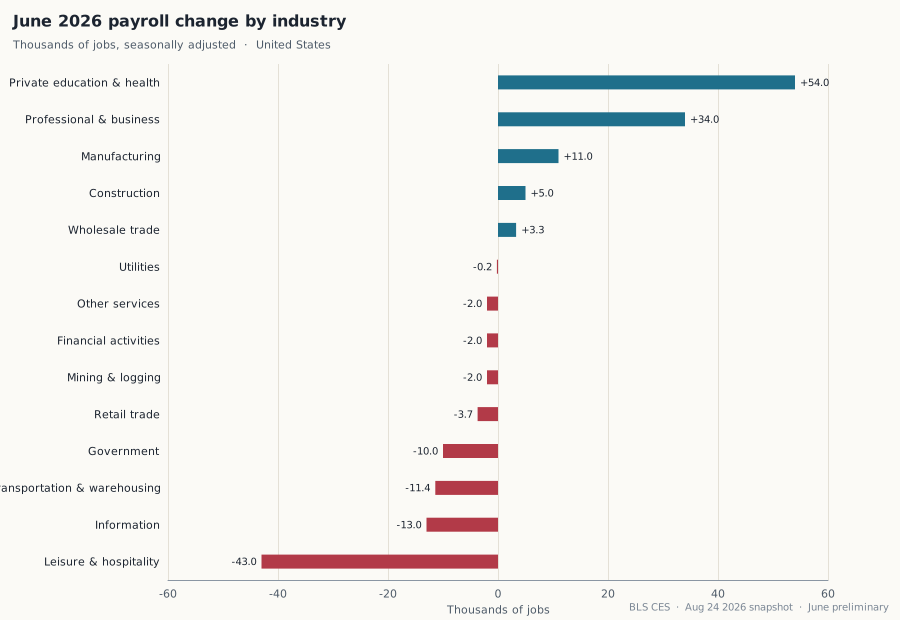
Seasonally adjusted monthly change in U.S. nonfarm payrolls by CES supersector, June 2026, thousands of jobs. The broader private education and health services group, which includes NAICS 62 plus private education, rose by 54,000. Source: U.S. Bureau of Labor Statistics, Current Employment Statistics. June 2026 is preliminary in the 24 August 2026 snapshot. Supersectors sum to total nonfarm within rounding of about 500 jobs.
The household survey’s employment-to-population ratio is a different survey, collected from homes rather than employers. This analysis does not re-estimate it. What the employer survey can say, without borrowing that ratio, is that the composition of payroll growth had already gone missing.
Two years of narrowing, then a stall
Calendar-year totals make the pattern harder to dismiss as noise. In 2022, after the pandemic rebound, payrolls rose by 4.53 million jobs and health care and social assistance accounted for only 18 percent of the net gain. In 2023 the total slowed to 2.52 million and care work’s share rose to 40 percent. In 2024 payrolls added 1.46 million jobs; care work supplied 61 percent of them.
In 2025 the rest of the job market went into reverse. Health care and social assistance added 686,100 jobs. The remaining 85 percent of payroll employment, taken together, lost 570,100. The net for the whole economy was just 116,000 jobs — an average of about 10,000 a month, against an average of 158,000 a month from February through December 2019.
Over the twelve months ending in June 2026, the same split persists. Payrolls rose by 403,000 jobs. Health care and social assistance added 612,100. The rest of nonfarm employment fell by 209,100.
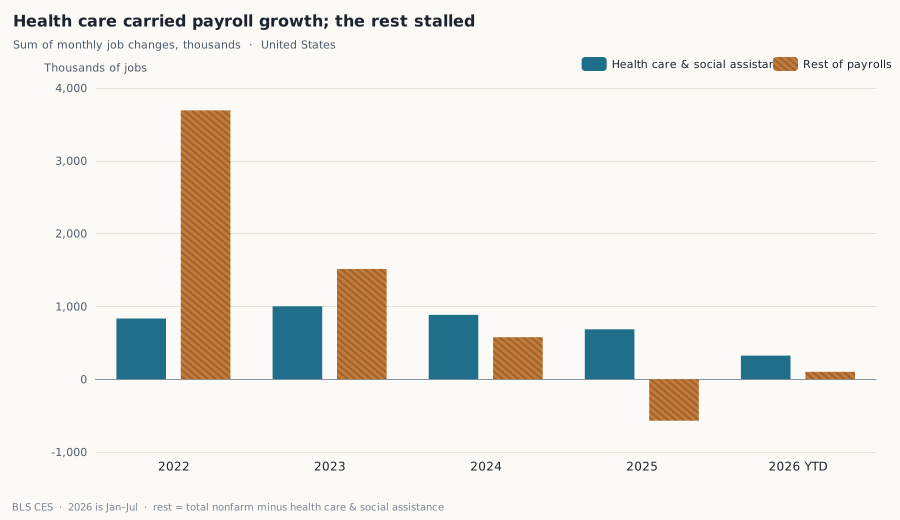
Sum of monthly seasonally adjusted job changes, thousands of jobs. “Rest of payrolls” is total nonfarm minus health care and social assistance, a constructed remainder rather than a published BLS series. 2026 is January–July, not a full year. Source: BLS CES.
| Period | Total nonfarm | Health care & social assistance | Rest of payrolls |
|---|---|---|---|
| 2022 | +4,526,000 | +834,300 | +3,691,700 |
| 2023 | +2,515,000 | +1,001,000 | +1,514,000 |
| 2024 | +1,459,000 | +882,700 | +576,300 |
| 2025 | +116,000 | +686,100 | −570,100 |
| Jan–Jul 2026 | +426,000 | +324,700 | +101,300 |
The 2026 year-to-date line looks healthier than 2025 because January, March, and April were strong. The three-month average change, a BLS series designed to smooth that bounce, was 77,000 jobs a month through June and 20,000 through July. Monthly prints still swing: February 2026 fell by 156,000 jobs and March rose by 214,000. The three-month line is the fairer read, and it has been crawling.
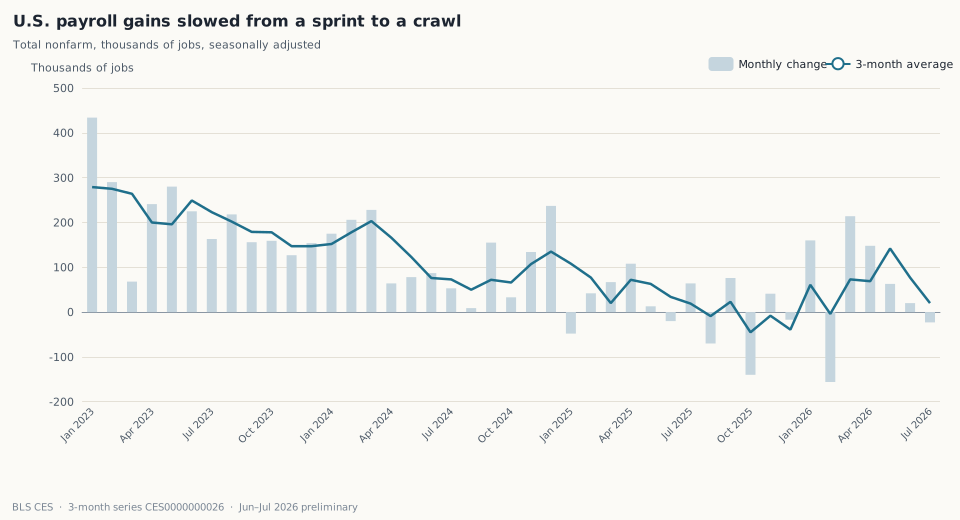
Monthly change in total nonfarm payrolls, thousands of seasonally adjusted jobs, with the BLS three-month average change (CES0000000001 and CES0000000026). June and July 2026 are preliminary.
Cooling, not a 2008-style crash
Temporary-help employment, a classic leading slice of the payroll survey, peaked at 3.16 million in March 2022. By June 2026 it was 2.50 million, 21 percent below that peak and below its 2019 average of 2.96 million. Agencies add temps when clients want labor they can drop quickly; they cut temps when demand cools. The long decline is consistent with weaker hiring appetite. It is not, by itself, a recession call.
Pay and hours point the same way without looking like a collapse. Average hourly earnings for all private employees were $37.60 in June 2026, 3.4 percent above a year earlier — slower than the 4.7 percent pace in June 2023, and close to the 3.5 percent year-over-year figure in the June recap. Average weekly hours were 34.3, a tenth of an hour below the 2019 average of 34.4 and below 34.6 in June 2022. Employers have not slashed the workweek. They have mostly stopped adding people outside care.
None of this explains why hiring narrowed. An aging population raises demand for health workers whether or not factories are hiring. Immigration, interest rates, public-sector budgets, and industry-specific shocks can all move a monthly print. The CES counts jobs; it does not assign causes. It also misses self-employment and can revise for months after the first release. June and July 2026 are still marked preliminary in this snapshot.
What the employer survey can settle is the claim that June’s softness was only a household-survey story. It was not. In later payroll data, the June gain shrinks, care work more than accounts for it, hotels and restaurants lose jobs, and the twelve-month remainder is negative. The United States is still creating health-care and social-assistance jobs. The rest of the payroll universe has been, for a year and more, a shrinking share of a slowing total.
Sources and methods
This is retrospective research completed on 10 September 2026, using a pinned CES snapshot whose latest month is July 2026. The June 2026 news day did not have that vintage. Figures are national, monthly, and seasonally adjusted. Employment is stored in thousands of jobs; a change of 20.0 is 20,000 jobs. Industry contributions use published CES series; “rest of payrolls” subtracts health care and social assistance from total nonfarm. Supersector levels in July 2026 sum to total nonfarm within 500 jobs, a rounding gap, not a missing industry. Official documentation is on the CES homepage and in the bulk series files.
Research Date
The displayed date matches the related news edition. Research was completed 2026-09-10.
Related news: Daily · 2026-07-02
More Research
Iran’s New Leader Inherits The Worst Slump Since The Iran-Iraq War
IMF estimates put Iran’s 2026 real-GDP contraction at 6.1 percent — worse than the 2010s sanctions years and the steepest since 1988 — as Mojtaba Khamenei inherits the economy after his fath
Before The Rubble: Venezuela’s Economy Had Already Shrunk By Two-Thirds
IMF figures show Venezuela entered the 2026 earthquakes with real output still only 31 percent of its 2013 level, 4 million fewer people, and a gutted tax take.
Germany’s Economy Is No Larger Than It Was In 2019
IMF growth rates show Germany uniquely contracted in 2023 and 2024, leaving real GDP essentially where it was in 2019.