LunarWeave
Before The Rubble: Venezuela’s Economy Had Already Shrunk By Two-Thirds
Twin earthquakes in late June 2026 buried neighbourhoods and overwhelmed rescue crews. Officials put the death toll above 2,000, with tens of thousands still missing; aid agencies warned of hunger and disease in a health system that was already failing. Those figures come from contemporaneous reporting, not from the statistics below. The economic record answers a prior question that decides how much damage a disaster can do: how much of Venezuela’s economy, population and public revenue had already disappeared before the ground shook?
The International Monetary Fund’s World Economic Outlook describes a collapse that has few peacetime equals. By 2025 — the last full year before the quakes — real output was only 31 percent of its 2013 level. About 4.15 million people were missing from the population estimate relative to the 2016 peak. Government revenue, which had been more than a quarter of GDP on the eve of the slump, briefly fell below 5 percent. The earthquakes did not hit a normal middle-income country. They hit what was left of one.
Seven years of contraction
IMF real GDP growth (choose Venezuela in the chart) is an annual percent change, not a level. Compounding those rates into an index with 2013 equal to 100 makes the lost volume of output visible. Venezuela then recorded seven consecutive contractions, including −27.7 percent in 2019 and −30.0 percent in 2020. By 2020 the index stood at 25.7. A 21 percent rebound from that trough still left 2025 output 68.9 percent below 2013.
Colombia, next door, is not a controlled comparison — it has its own oil, politics and 2020 pandemic dip — but it shows what a neighbouring economy did in the same years. Its real-GDP index rose from 100 in 2013 to 137 in 2025.
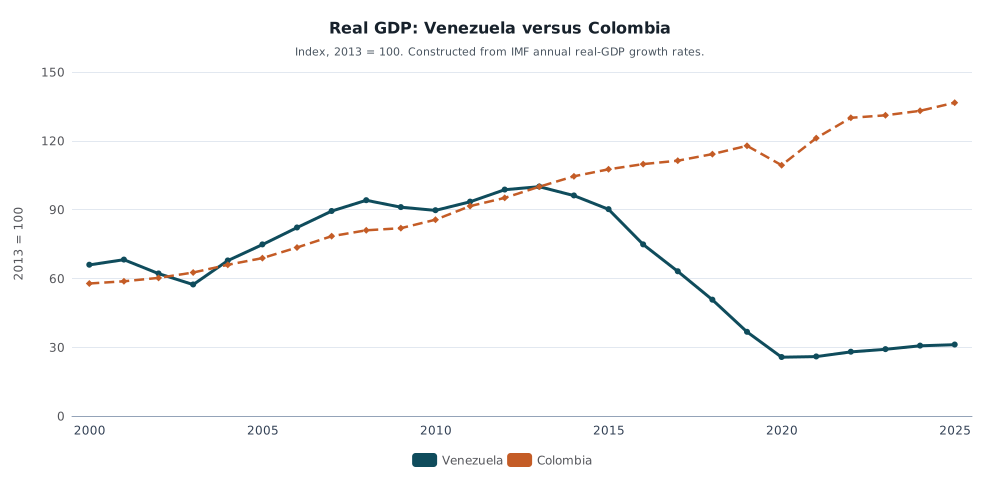
Real GDP indexed to 2013 = 100, constructed from IMF WEO annual percent changes in constant-price GDP. Venezuela and Colombia, 2000–2025. 2024–2025 are IMF estimates. The index tracks the volume of output, not current-dollar GDP.
Current-dollar GDP mixes volumes with prices and the exchange rate, so it is not a second reading of the same collapse. The growth-rate index is the cleaner statement of how much less there was to tax, import or repair with.
People left, then the state shrank
The IMF’s population estimates (choose Venezuela) peaked at 30.71 million in 2016 and bottomed at 26.56 million in 2024 — a loss of 4.15 million people, or 13.5 percent. The 2025 estimate ticked up only slightly, to 26.67 million. These are not border counts, and they do not say how many of those people later boarded U.S. removal flights. They do show that the country the quakes struck was already several million smaller than a decade earlier.
Colombia’s estimated population rose about 14.5 percent between 2015 and 2025. Indexed to each country’s own 2016 level, Venezuela is at 87 in 2025; Colombia is at 113.
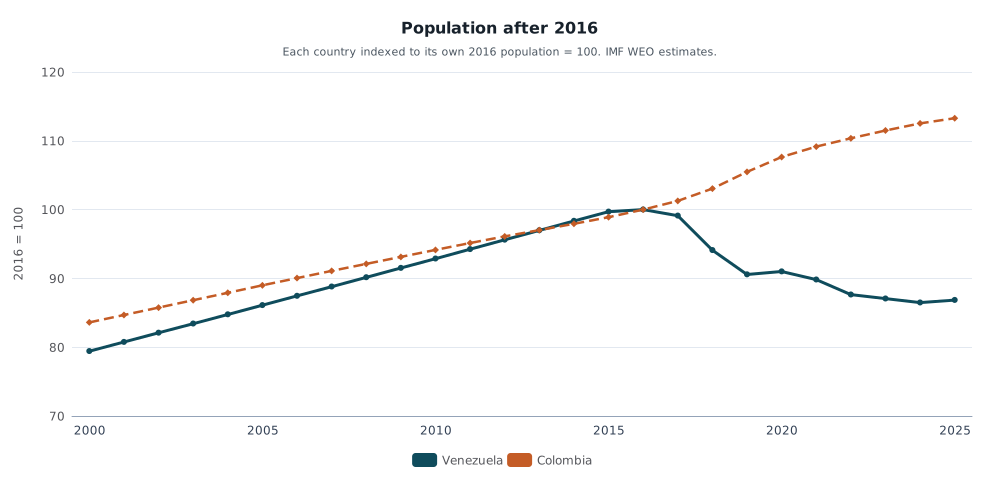
IMF WEO population estimates, each country indexed to 2016 = 100. Venezuela’s estimated headcount is not a census of emigrants.
Fewer people would, other things equal, raise output per person. Other things were not equal. GDP per capita at purchasing-power parity — current international dollars, useful for a same-year comparison — peaked in Venezuela at about $18,851 in 2013, fell to about $5,730 in 2020, and recovered only to about $8,911 in 2025, still 53 percent below the 2013 peak. Colombia, which had been about 31 percent below Venezuela on this measure in 2013, was 2.5 times Venezuela’s level by 2025.
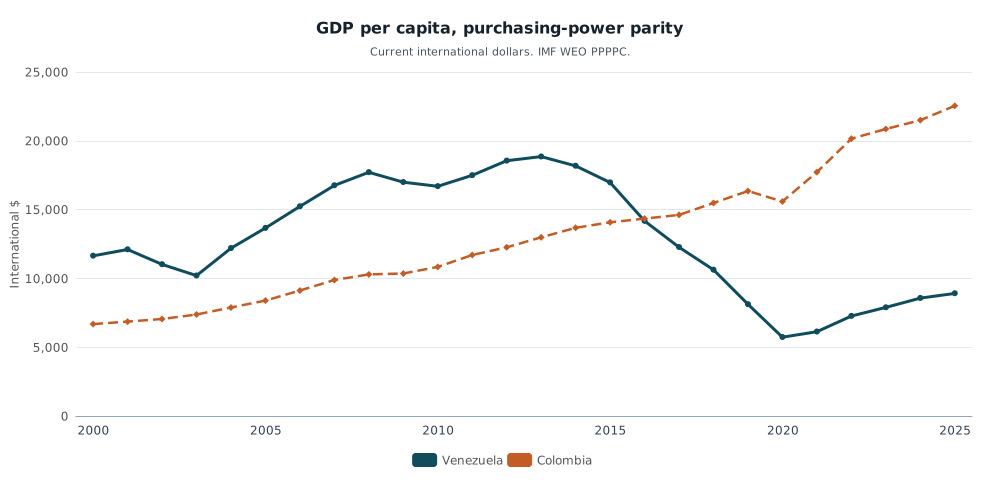
IMF WEO GDP per capita in current international dollars (PPP). Current-PPP dollars are not a constant-price welfare series; they still rank the two countries in a given year.
Public finance collapsed with the tax base. General government revenue (choose Venezuela) was 26.1 percent of GDP in 2013 and 4.5 percent in 2020. Even after a partial recovery to 14.5 percent in 2025, the state was collecting a smaller share of a much smaller economy. That is the statistical counterpart of reporting that rescue work ran into a thin official presence.
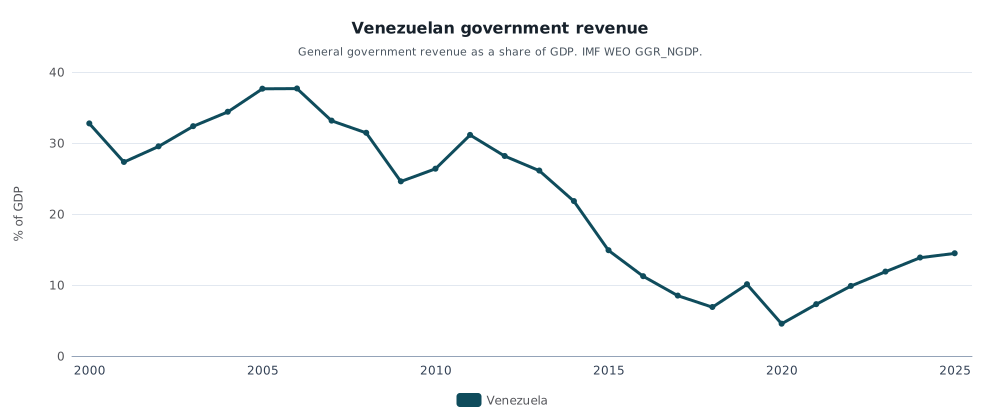
IMF WEO general government revenue as a percent of GDP, Venezuela, 2000–2025. Because GDP itself shrank, the drop in real resources is larger than the drop in the ratio.
Hyperinflation destroyed the unit of account along the way. Average consumer prices rose more than 65,000 percent in 2018 on the IMF’s measure, slowed to about 49 percent in 2024, then re-accelerated to about 252 percent in 2025. Households and ministries that cannot keep a currency stable do not stockpile hospital supplies.
| Year | Real GDP (2013 = 100) | Population (millions) | GDP per capita, PPP (int’l $) | Gov. revenue (% of GDP) |
|---|---|---|---|---|
| 2013 | 100.0 | 29.79 | 18,851 | 26.1 |
| 2020 | 25.7 | 27.95 | 5,730 | 4.5 |
| 2025 | 31.1 | 26.67 | 8,911 | 14.5 |
Venezuela. Real GDP is a constructed index from IMF growth rates; other columns are IMF WEO levels. 2025 figures are estimates.
What the numbers cannot say
None of this measures collapsed buildings, missing people, or the 146 Venezuelans who, according to the New York Times, were deported from the United States on the day of the quake. It does not prove that a richer Venezuela would have saved more lives. Disaster mortality depends on building codes, epicentre, and hours of search time as well as on GDP.
What the record does establish is the starting point. Deutsche Welle reported an overwhelmed health system and warnings of hunger and disease. Those warnings sit on top of a decade in which output, people and tax revenue all left at once. The modest 2021–2025 rebound did not restore 2013. When the earthquakes arrived, Venezuela was still living with roughly a third of that earlier economy.
Sources and methods
This is retrospective research completed on 10 September 2026 about events reported on 1 July 2026. It uses an IMF WEO snapshot ingested on 24 August 2026, which includes later estimates than were available on 1 July 2026. Years 2024–2025 should be read as IMF estimates; 2026 and later projections were excluded because they neither describe the pre-quake year nor incorporate earthquake damage.
Series: real GDP percent change (NGDP_RPCH), population (LP), GDP per capita in current international dollars (PPPPC), and general government revenue as a percent of GDP (GGR_NGDP). Inflation uses average consumer prices (PCPIPCH). The real-GDP index compounds each year’s percent change, with 2013 set to 100; it is not an official IMF level series. Venezuela’s official statistics were already thin during hyperinflation, so levels — especially population and PPP dollars — carry wide uncertainty. Missing observations were not treated as zero. MacroVedia pages linked above are the same IMF series; they are not the original publisher, and the live chart does not pre-select Venezuela.
Research Date
The displayed date matches the related news edition. Research was completed 2026-09-10.
Related news: Daily · 2026-07-01
More Research
The Rest Of The U.S. Job Market Has Been Shrinking
Later BLS payroll data show June 2026’s job gain shrinking to 20,000, with health care and social assistance more than accounting for it, while the rest of U.S. payrolls have been declining
Iran’s New Leader Inherits The Worst Slump Since The Iran-Iraq War
IMF estimates put Iran’s 2026 real-GDP contraction at 6.1 percent — worse than the 2010s sanctions years and the steepest since 1988 — as Mojtaba Khamenei inherits the economy after his fath
Germany’s Economy Is No Larger Than It Was In 2019
IMF growth rates show Germany uniquely contracted in 2023 and 2024, leaving real GDP essentially where it was in 2019.