LunarWeave
The United States Is Still Larger Than China In Dollars. Its Budget Deficit Is The Outlier.
On 5 July 2026, the Times of India summarised Deutsche Bank research as a warning that America’s public debt, not foreign rivals, had become the main threat to US economic dominance. Persistent deficits and rising interest costs, the bank said, were eroding a long-standing advantage.
That framing mixes two claims that can be checked separately. Has the United States actually lost ground as the world’s largest economy, in the dollars that still dominate trade, finance and official reserves? And is its public-debt position unusual among large economies, or merely high?
The International Monetary Fund’s World Economic Outlook accounts give a split answer. In current US dollars, the American economy is still far larger than China’s, and the gap widened after 2019. On a purchasing-power-parity basis, China is already bigger. What stands out among large economies is not the US debt stock — Japan and Italy are higher — but a general-government deficit that was still 7.9 percent of GDP in 2024, most of it a primary gap rather than interest. The figures cannot say whether debt will undercut dollar primacy. They can say whether the size contest is already lost, and whether Washington’s fiscal arithmetic looks like that of other high-debt countries.
The dollar scoreboard has not flipped
In 2024 the United States produced $29.3 trillion of GDP at current prices, against $18.9 trillion for China. The dollar gap was $10.4 trillion, up from $6.9 trillion in 2019. The US/China ratio rose from 1.48 to 1.55.
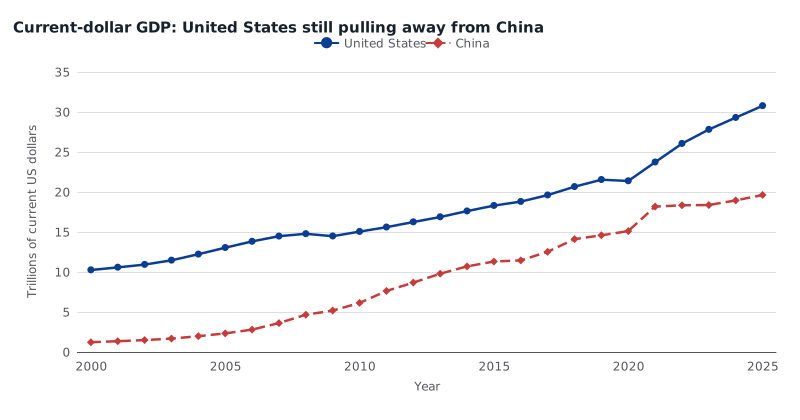
Gross domestic product at current prices, trillions of US dollars, 2000–2025. The United States remains far larger than China on this measure, and the dollar gap widened after 2019. 2025 is an IMF staff figure in the pinned snapshot; earlier years are that snapshot’s historical series. Current-dollar comparisons move with exchange rates as well as real output. Source: IMF World Economic Outlook, NGDPD. Select the country on the linked series page.
The United States also gained world share on this measure. Its slice of world current-dollar GDP rose from 24.3 percent in 2019 to 26.3 percent in 2024. China’s dollar share was 16.5 percent in 2019 and 17.0 percent in 2024, easing from an early-2020s peak. That is not because China stopped growing: real GDP rose 5.0 percent there in 2024 and 2.8 percent in the United States. Dollar comparisons also move with inflation and with the yuan, so faster real growth in China can still leave a wider dollar gap.
Purchasing power already tells a different story
On the IMF’s purchasing-power-parity measure, China accounted for 19.3 percent of world GDP in 2024, against 14.8 percent for the United States. In 2019 those shares were 17.6 and 15.3 percent. In 2000 they were 6.7 and 20.4 percent.
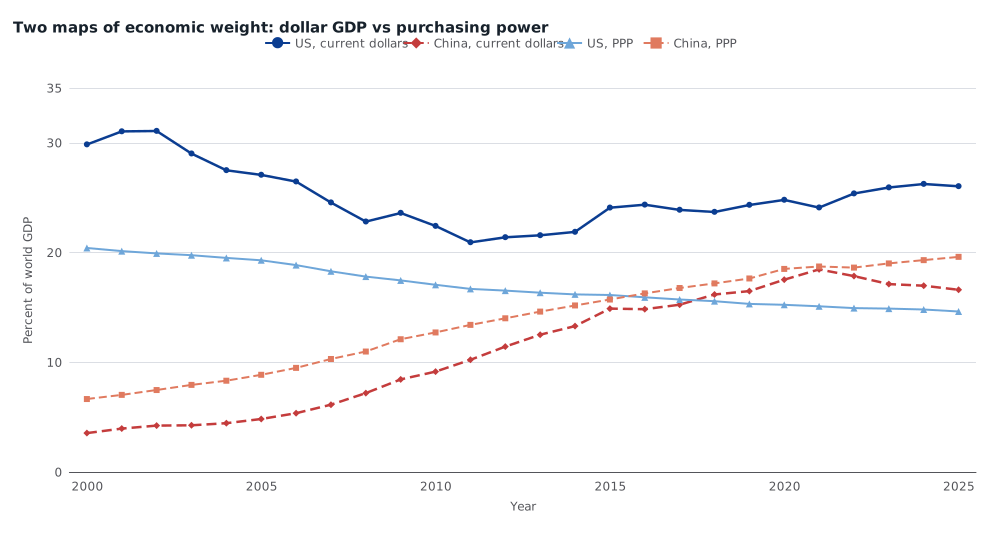
Share of world GDP, percent, 2000–2025. Solid and dashed dark lines are current-dollar shares (each country’s NGDPD divided by the IMF world total). Triangle and square lines are IMF purchasing-power-parity shares (PPPSH). On PPP, China overtook the United States before 2019; in current dollars the US share rose after 2019. 2025 is an IMF staff figure. Source: IMF World Economic Outlook.
PPP is the better map of who produces more, because it adjusts for different price levels. It is not the map of who issues the reserve currency or clears most cross-border finance. On the dollar map, China has not caught the United States. On the PPP map, it already has.
A high debt stock is not the distinctive US fact
US general government gross debt was 122.3 percent of GDP in 2024, up from 108.8 percent in 2019 and 64.9 percent in 2007, after a 132.6 percent peak in 2020. Net debt, which subtracts financial assets, was 95.7 percent of GDP in 2024, versus 81.6 percent in 2019 and 44.0 percent in 2007. These IMF ratios include state and local government, not federal debt alone, and they are not household or corporate debt.
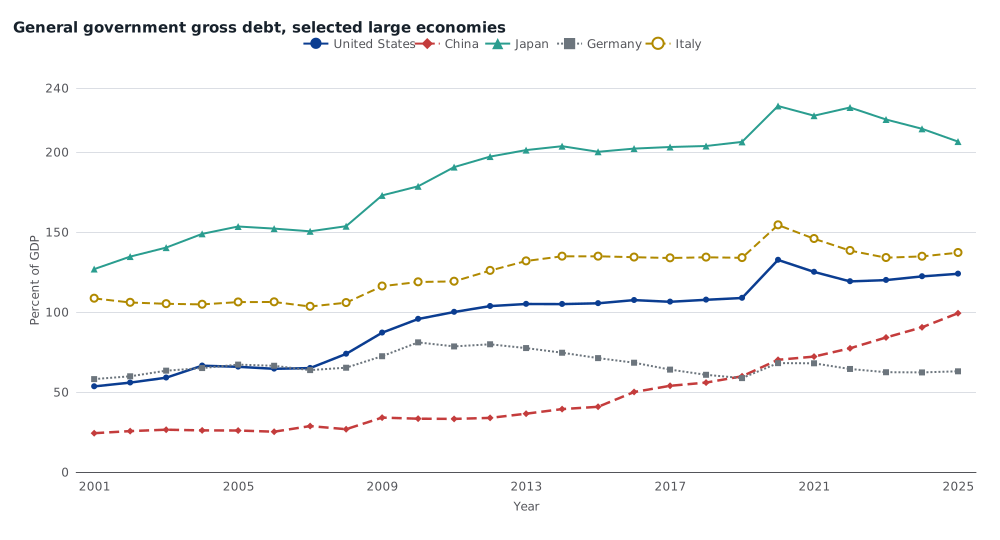
General government gross debt as a percent of GDP, 2001–2025. The US series starts in 2001. These are IMF general-government ratios, which include state and local government for the United States, not federal debt alone. 2025 is an IMF staff figure. Source: IMF World Economic Outlook, GGXWDG_NGDP.
The stock is high, not unique. In 2024 Japan’s ratio was 214.5 percent of GDP and Italy’s 134.7 percent. Germany was 62.2 percent. China was 90.4 percent, but it rose 30.6 percentage points from 2019 to 2024, compared with 13.5 points for the United States. High debt can persist when interest costs are low and the primary budget is close to balance. That is why the 2024 flow matters more than the league table of stocks.
The 2024 deficit is what sets the United States apart
US general government net lending/borrowing was −7.9 percent of GDP in 2024. Among the large economies compared here, that was the widest deficit: China −7.1 percent, the United Kingdom −6.1 percent, France −5.8 percent, Italy −3.4 percent, Germany −2.7 percent, Japan −1.7 percent. In 2019, before the pandemic, the US balance was already −5.8 percent of GDP. It was −14.1 percent in 2020 and had not returned to the pre-pandemic gap by 2024.
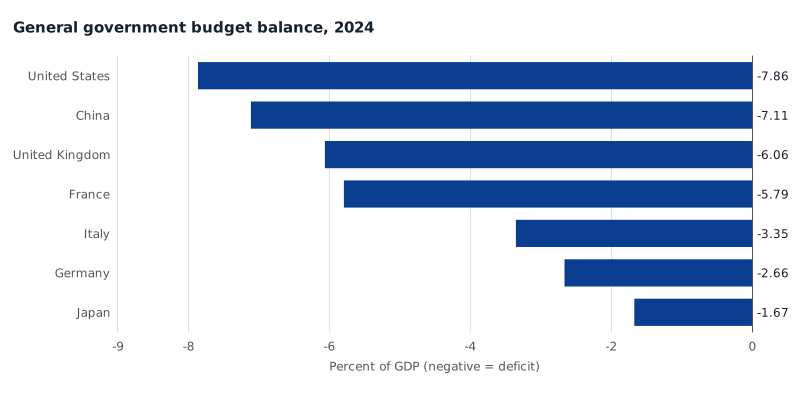
General government net lending/borrowing as a percent of GDP in 2024. Negative values are deficits. The US deficit of 7.9 percent of GDP was the largest among these large economies. Source: IMF World Economic Outlook, GGXCNL_NGDP.
The composition of that US gap is the sharper comparison with other high-debt countries. In 2024 the 7.9 percent overall deficit split into a 4.4 percent primary deficit — the balance before interest — and about 3.5 percent of GDP in implied interest, up from about 2.3 percent in 2019. That interest figure is an identity (primary minus overall net lending), not US Treasury net interest as scored in the federal budget.
Italy, with a higher debt ratio, ran a small primary surplus of 0.3 percent of GDP in 2024. Its implied interest, 3.6 percent of GDP, was similar to the United States. Japan combined a 214.5 percent debt ratio with a 1.7 percent overall deficit and implied interest of about 0.1 percent of GDP. The United States looks like Italy on the interest line and unlike Italy or Japan on the primary balance.
Revenue and spending tell the same story from the other side. US general government revenue was 29.9 percent of GDP in 2024, almost unchanged from 30.0 percent in 2019, while expenditure was 37.7 percent, up from 35.8 percent.
| Economy, 2024 | GDP, current $trn | Gross debt, % of GDP | Budget balance, % of GDP | Primary balance, % of GDP | Implied interest, % of GDP |
|---|---|---|---|---|---|
| United States | 29.3 | 122.3 | −7.9 | −4.4 | 3.5 |
| China | 18.9 | 90.4 | −7.1 | — | — |
| Japan | 4.2 | 214.5 | −1.7 | −1.6 | 0.1 |
| Germany | 4.7 | 62.2 | −2.7 | −1.9 | 0.8 |
| Italy | 2.4 | 134.7 | −3.4 | 0.3 | 3.6 |
| France | 3.2 | 113.2 | −5.8 | −4.0 | 1.8 |
| United Kingdom | 3.7 | 99.9 | −6.1 | −4.0 | 2.0 |
IMF World Economic Outlook, 2024. GDP is NGDPD in trillions of current dollars; debt is general government gross debt (GGXWDG_NGDP); budget balance is net lending/borrowing (GGXCNL_NGDP); primary balance is GGXONLB_NGDP. Implied interest is primary minus overall balance. China is omitted from the last two columns because this article does not use that series for China. Totals may not sum because of rounding.
Staff projections in this snapshot put US general government gross debt at 125.8 percent of GDP in 2026 and 138.9 percent in 2030, with overall deficits still around 7.5 percent of GDP. Those later years are not outcomes, and they do not demonstrate that dollar dominance ends.
What the accounts show — and what they cannot
Deutsche Bank’s reported warning treats rivals and debt as competing explanations for whether US economic primacy is durable. On the dollar-GDP map that still governs financial power, the rival has not caught up: the United States pulled further ahead of China after 2019. On purchasing power, China is already the larger economy. The fiscal accounts do not show that US debt is uniquely high. They show that the United States is adding to an already-high stock at a pace Japan and Italy did not match in 2024, because it is still running a large primary deficit after interest costs have risen.
That is a real tension, not proof that public debt will topple the dollar or outweigh deep markets and reserve-currency demand. The series also say nothing about Social Security or Medicare trust-fund dates mentioned in the news report. The unusual American number in 2024 was the gap between what general government collected and what it spent, before the debt-service line.
Methods and sources
This is retrospective research, written on 10 September 2026 about reporting from 5 July 2026, using a pinned IMF World Economic Outlook snapshot dated 24 August 2026 (raw extract 10 August 2026). That vintage was not available on the news day; later releases can revise history. The snapshot does not flag estimates against actuals. This article treats 2024 as history, 2025 as a staff figure that may still be an estimate, and 2026–2030 as staff projections.
Current-dollar world shares divide each country’s NGDPD by the IMF world aggregate (geography G001), identified by matching US PPPGDP divided by the US PPP share to G001 PPPGDP. Debt and budget figures are general government, not federal-only. Implied interest is GGXONLB_NGDP minus GGXCNL_NGDP; GGXONLB is the IMF primary-balance code, not the structural balance. Official definitions are on the IMF WEO pages linked above. MacroVedia series pages are multi-country charts: choose the country in the selector. Live portal points for the 2019 and 2024 figures cited here matched this snapshot when checked; the portals are not the statistical producer. The Times of India item is a short news summary of Deutsche Bank research, not the bank’s full note.
Research Date
The displayed date matches the related news edition. Research was completed 2026-09-10.
Related news: Daily · 2026-07-05
More Research
AI Data Centres Are Arriving On Grids That Were Not Expanding
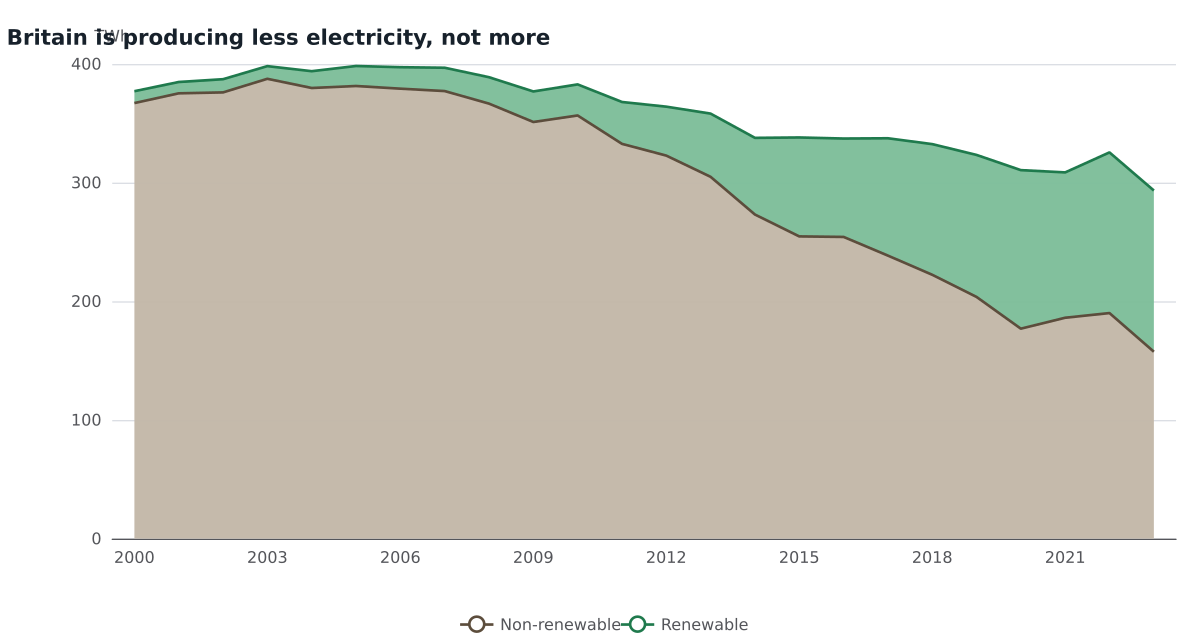
IRENA generation data through 2023 show UK electricity output down 23 percent from 2010 and US output barely higher, even as AI data-centre projects promise renewable power.
Germany’s Economy Is No Larger Than It Was In 2019
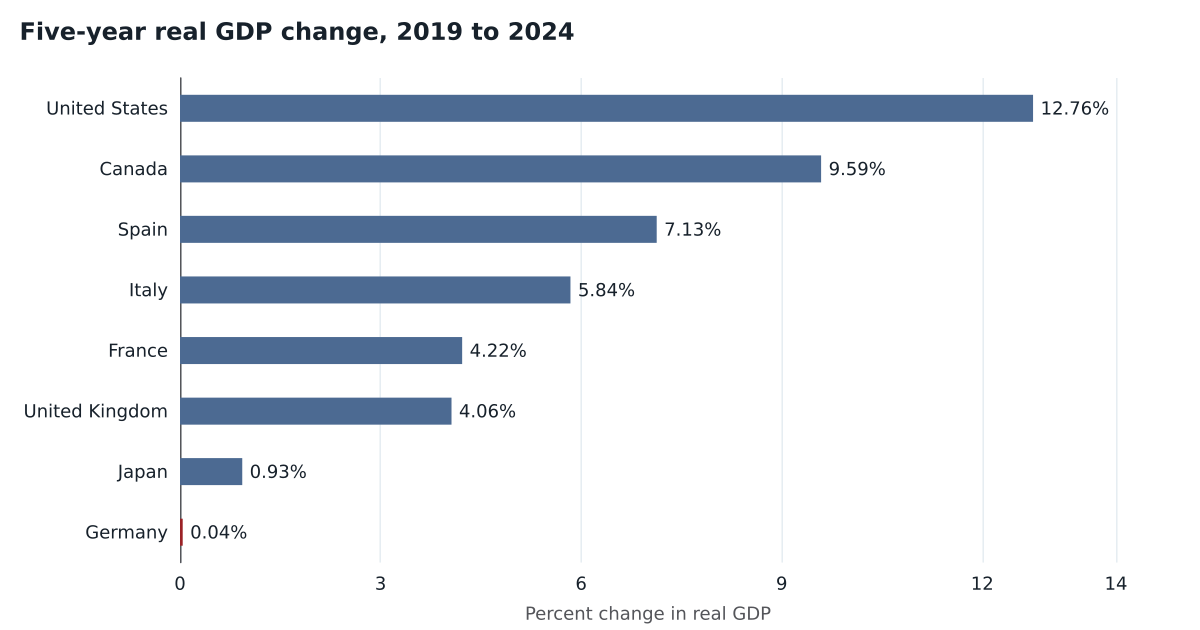
IMF growth rates show Germany uniquely contracted in 2023 and 2024, leaving real GDP essentially where it was in 2019.
The AI Boom Is Not A US Chip-Factory Hiring Boom
US semiconductor manufacturing payrolls were 180,300 in June 2026, near the 2017 low, even as software and cloud jobs stayed well above 2019.