LunarWeave
AI Data Centres Are Arriving On Grids That Were Not Expanding
When the British government promoted an £8.2 billion AI campus in Lanarkshire, the selling point was not only jobs. The complex would, officials said, be powered entirely from on-site renewables. A Guardian investigation has since reported that there is no realistic path to that promise, and that developers privately treated power supply as an “issue.” Scotland’s governing party has now asked ministers to consider freezing new data centres. In Henrico County, Virginia, a place that welcomed dozens of server farms, schools have been told to dim lights after electricity bills jumped about 25 percent, according to local reporting.
Those disputes are usually framed as a fight over whether data centres can be “green.” A prior question is simpler: have the countries that want to host this load actually been producing more electricity?
They have not. In the latest IRENA generation statistics, Britain generated 293.4 terawatt-hours of electricity in 2023 — 23 percent less than in 2010, and 22 percent less than in 2000. The United States generated about 4,453 TWh, only 1.7 percent more than in 2010. Renewables took a larger share in both countries. They did so mostly by replacing other generation, not by creating a surplus waiting for hyperscale computing.
Britain’s shrinking pie
UK electricity output peaked in the mid-2000s near 400 TWh and has been drifting down for a decade and a half. By 2019 it was already 323.4 TWh. In 2023 it was 293.4 TWh, almost 10 percent below 2022. That last drop is large enough to matter, but it is not the whole story: the 2023 figure is 89 TWh below 2010.
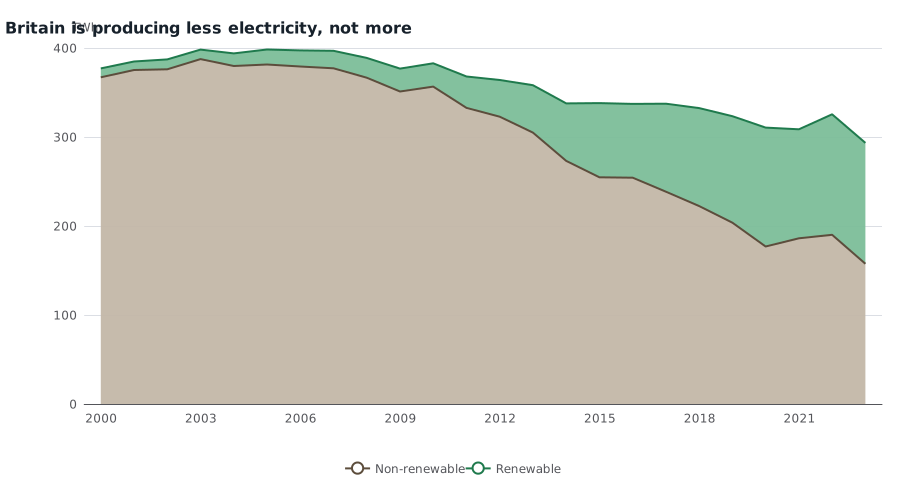
United Kingdom electricity generation, TWh, 2000–2023. Stacked areas are IRENA total renewable and total non-renewable generation. Pumped storage (1.8 TWh in 2023) is excluded. Source: IRENASTAT.
What rose is the renewable share, from 2.6 percent of generation in 2000 to 6.8 percent in 2010 and 46.3 percent in 2023. In absolute terms, renewable generation climbed from 10.0 TWh to 135.8 TWh. Non-renewable generation fell much faster, from 367.1 TWh to 157.6 TWh. Wind now supplies most of the green slice: 82.3 TWh in 2023, 49.5 of it offshore. Solar photovoltaic added 13.9 TWh. Renewable hydropower, often assumed to make Scotland a special case, was only 5.5 TWh for the whole United Kingdom.
The rest of the 2023 mix is still dominated by thermal and nuclear plants. Natural gas generated 102.2 TWh — more than any other single source, renewable or not. Nuclear contributed 40.6 TWh, less than half the 85.1 TWh recorded in 2000. Coal is nearly gone, at 4.7 TWh.
These are national generation figures, not a Scottish grid balance sheet, and generation is not the same as consumption. Britain can import power over interconnectors, and falling output can reflect weaker demand, more imports, retired plants, or some mix of the three. IRENA does not identify data-centre load. None of that creates spare domestic electrons. A campus that needs a large, constant block of power still has to take it from new plants, from imports, or from other users.
America replaced coal. It did not build a bigger system.
The United States is not Britain. It generates more than fifteen times as much electricity, and its total has not collapsed. It has not boomed either. Output was 4,378 TWh in 2010 and 4,453 TWh in 2023. Relative to 2015, the increase is 3.1 percent. Indexed to 2010, US generation in 2023 sat at 101.7; Britain’s sat at 76.6. Ireland, a much smaller system often cited in data-centre debates, did grow — to 31.9 TWh, 12 percent above 2010 — while lifting its renewable share to 44.8 percent. Even there, the entire country’s generation is a rounding error on US output.
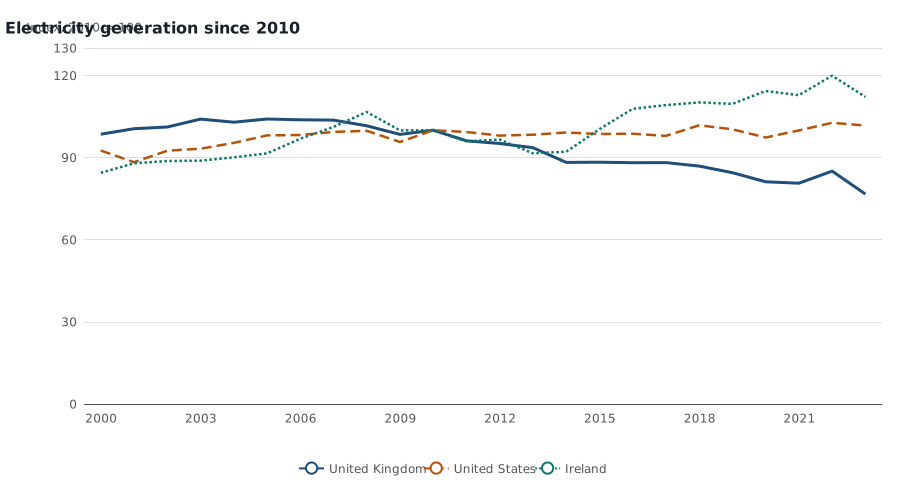
Electricity generation indexed to 2010 = 100. Each series is IRENA renewable plus non-renewable generation. Latest year 2023. Source: IRENASTAT.
Inside the flat US total, the fuel mix changed sharply. Coal generation fell from 1,994 TWh in 2010 to 742 TWh in 2023. Natural gas rose from 1,018 TWh to 1,865 TWh and now supplies 41.9 percent of US generation. Nuclear was roughly unchanged at 808 TWh. Renewables more than doubled, from 441 TWh to 962 TWh, and reached 21.6 percent of the mix — still half Britain’s renewable share, and still smaller than gas alone.
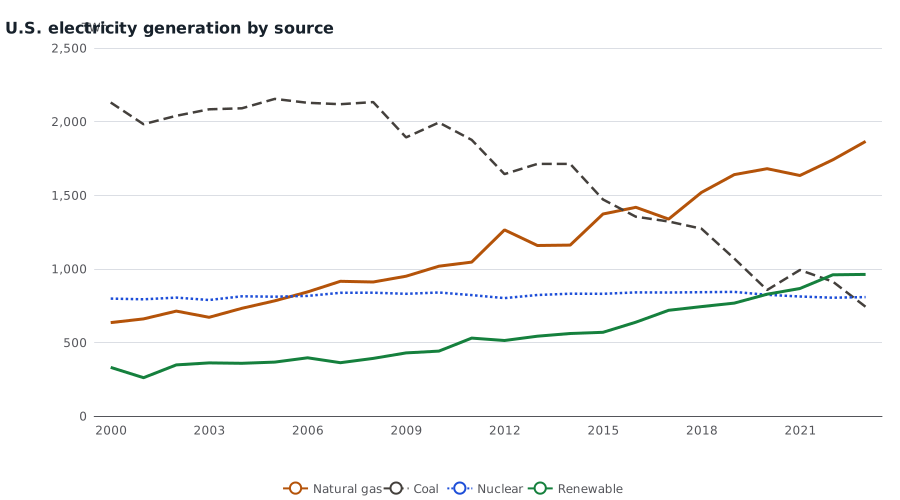
United States electricity generation by source, TWh, 2000–2023. Renewable is IRENA’s total renewable series. Source: IRENASTAT.
That is the arithmetic behind county-level fights over school power bills. If total generation barely grows, a new industrial load is not absorbed by a rising tide. It competes for existing supply, bids against other customers, or waits for plants that have not yet been built. The Henrico bill increase is reported, not measured here, and household electricity spending is a different series from commercial rates. The national generation record is enough to show why a cluster of data centres can strain a local utility even when the country is not in an electricity boom.
| 2010 total (TWh) | 2023 total (TWh) | Change | Renewable share, 2010 | Renewable share, 2023 | |
|---|---|---|---|---|---|
| United Kingdom | 382.8 | 293.4 | −23.4% | 6.8% | 46.3% |
| United States | 4,378 | 4,453 | +1.7% | 10.1% | 21.6% |
| Ireland | 28.4 | 31.9 | +12.2% | 13.3% | 44.8% |
Totals are IRENA renewable plus non-renewable generation, rounded. Renewable share is renewable generation divided by that total.
What the figures cannot say
They cannot verify the Lanarkshire project’s on-site renewable design, Scotland’s future moratorium, or a Virginia school district’s tariff. They cannot split England from Scotland, or data centres from steel mills and heat pumps. They stop in 2023, before the loudest years of the AI buildout; later generation may already look different. IRENA’s renewable category includes biomass and other fuels as well as wind and solar, so a rising “renewable” share is not the same as a rising share of new, additional wind and solar built for a specific campus.
They can say this. By 2023, the United Kingdom was producing a lot less electricity than it did in 2010, and the United States was producing only about as much. In both places, cleaner power mostly replaced dirtier power. That is a real climate change. It is not a stockpile of unused green electricity. New loads that need a large, constant block of power are asking these grids to do something they have not been doing: grow.
Methods and sources
This is retrospective research, written on 10 September 2026, about reporting from 6 July 2026. It uses the IRENASTAT country generation tables in a pinned MegaVedia snapshot whose latest complete year for these series is 2023. Observation years are not release dates; the 2023 figures were not, by themselves, proof of what was knowable in July 2026. Totals are the sum of IRENA’s “Total renewable” and “Total non-renewable” electricity generation, all grid connections, converted from gigawatt-hours to terawatt-hours. Pumped-storage generation is reported separately and is not added. Official series: IRENASTAT / PxWeb.
Research Date
The displayed date matches the related news edition. Research was completed 2026-09-10.
Related news: Daily · 2026-07-06
More Research
The AI Boom Is Not A US Chip-Factory Hiring Boom
US semiconductor manufacturing payrolls were 180,300 in June 2026, near the 2017 low, even as software and cloud jobs stayed well above 2019.
The United States Is Still Larger Than China In Dollars. Its Budget Deficit Is The Outlier.
IMF accounts show the US–China dollar-GDP gap widened after 2019, while the United States ran the largest general-government deficit among large economies in 2024.
The 3 Percent World Is Still Asia’s Expansion
The IMF’s 3 percent 2026 world-growth figure is a slower, Asia-weighted expansion under an $80 average Brent assumption — not a 2008-style oil-shock recession.