LunarWeave
The Household Energy Spike That Returned Was The Gas Bill, Not The Pump
When crude oil jumped and Washington announced a bargain to put Russian diesel onto world markets, the implied household story was liquid fuel: fill the tank, heat the basement, watch the pump. The latest complete U.S. household spending accounts tell a different story. In 2025, Americans spent less at the pump than they had the year before. The energy line that jumped again — back to its 2022 crisis level — was natural gas. Electricity, not heating oil, remained the large household energy bill.
That does not make $105 oil cheap, and it does not measure winter 2026. It does say where the last full year of household books actually tightened.
A diesel deal aimed at last year's fuel
On 9 October 2026, Media Indonesia reported Brent at $105 a barrel after President Trump considered a strike on Iran. The same day, Yeni Şafak and Dong-a Ilbo reported a phone-call deal with Vladimir Putin to release Russian diesel, with shipments described in hundreds of thousands of tonnes. Other outlets called the cargo fuel oil. Those volumes and labels are reported, not audited here. What can be measured is the household spending those announcements were meant to soothe.
The Bureau of Economic Analysis's function table of personal consumption expenditures (PCE) splits household energy into the furnace and the tank. "Motor vehicle fuels, lubricants, and fluids" is mostly gasoline for household cars. "Natural gas," "electricity," and "fuel oil and other fuels" sit under housing utilities. Trucking diesel — the market a diesel bargain actually targets — is largely a business cost, not a household consumption line. Heating oil is the household distillate, and it is small.
In current dollars, US households spent $389.8 billion on motor-vehicle fuels in 2025, 6.2% less than in 2024 and 19.1% below the 2022 peak of $481.7 billion. Natural-gas spending was $78.0 billion, 22.8% above 2024 and 99% of the 2022 level ($78.8 billion). The two series had risen in lockstep through the 2022 shock. They then diverged.
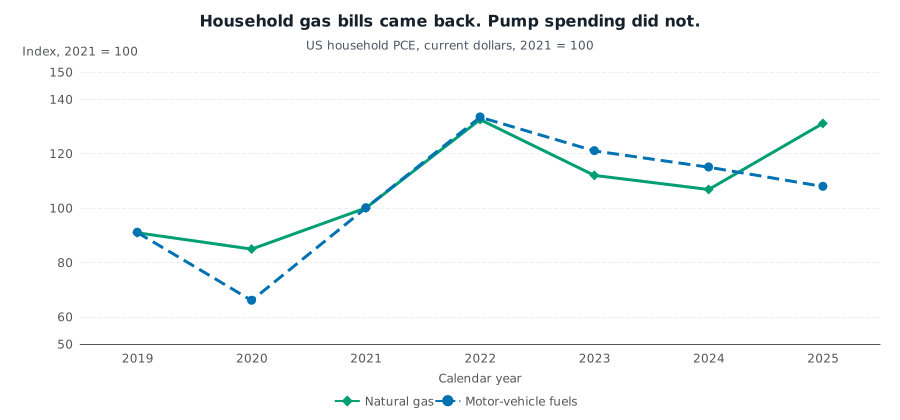
US household personal consumption expenditures on natural gas and on motor-vehicle fuels, lubricants and fluids, indexed to 2021 = 100 using current dollars. Calendar years 2019–2025. Source: U.S. Bureau of Economic Analysis, PCE by state (SAPCE4 function table), United States. An index of nominal spending mixes prices and quantities; 2025 is the latest complete year and is not winter 2026–27.
Electricity did not retrace. Heating oil never became the story.
Dollar levels make the mix harder to miss. Electricity spending kept rising after 2022, to $269.9 billion in 2025 — 15.9% above 2022. Fuel oil and other fuels, the category that includes household heating oil, was $29.0 billion, still a rounding error next to the pump.
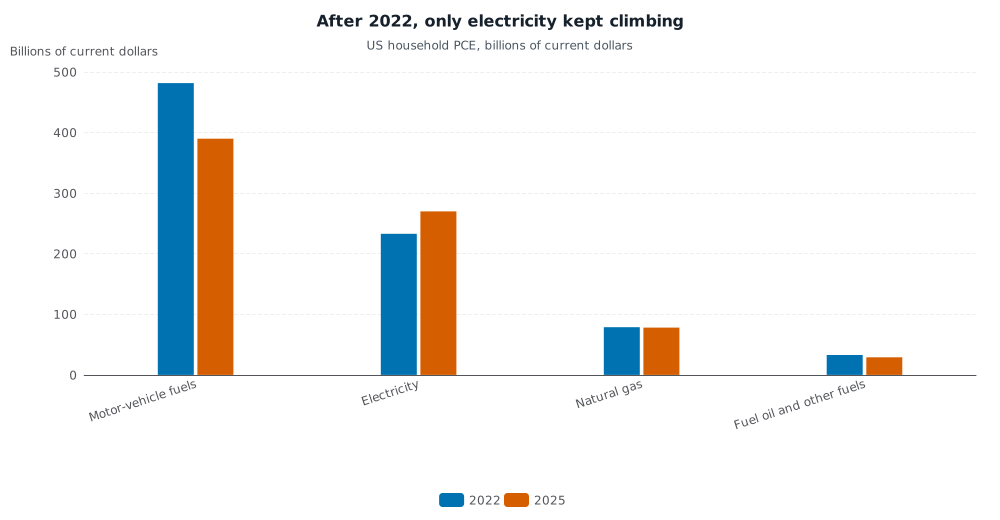
US household PCE in billions of current dollars, calendar years 2022 and 2025. Source: BEA PCE by state (SAPCE4). Nominal dollars; motor-vehicle fuels are mostly gasoline, not trucking diesel.
| Category (US household PCE) | 2022 | 2025 | Change |
|---|---|---|---|
| Motor-vehicle fuels, lubricants, and fluids | $481.7 bn | $389.8 bn | −19.1% |
| Electricity | $232.9 bn | $269.9 bn | +15.9% |
| Natural gas | $78.8 bn | $78.0 bn | −1.0% |
| Fuel oil and other fuels | $32.9 bn | $29.0 bn | −11.8% |
The 2022–2025 column for natural gas looks calm only because 2025 undid the decline of 2023–24. From 2024 to 2025, gas spending rose $14.5 billion while total PCE rose 5.3%. Motor-fuel spending fell in the same year.
As a share of the consumption basket, motor-vehicle fuels were 1.87% of PCE in 2025, down from 2.73% in 2022. Electricity was 1.29%. Natural gas was 0.37%. Fuel oil and other fuels was 0.14%. Put the three home-energy lines together and they almost match the pump: 1.81% of spending versus 1.87%. In 2022 that home-to-motor ratio was 0.72. In 2025 it was 0.97.
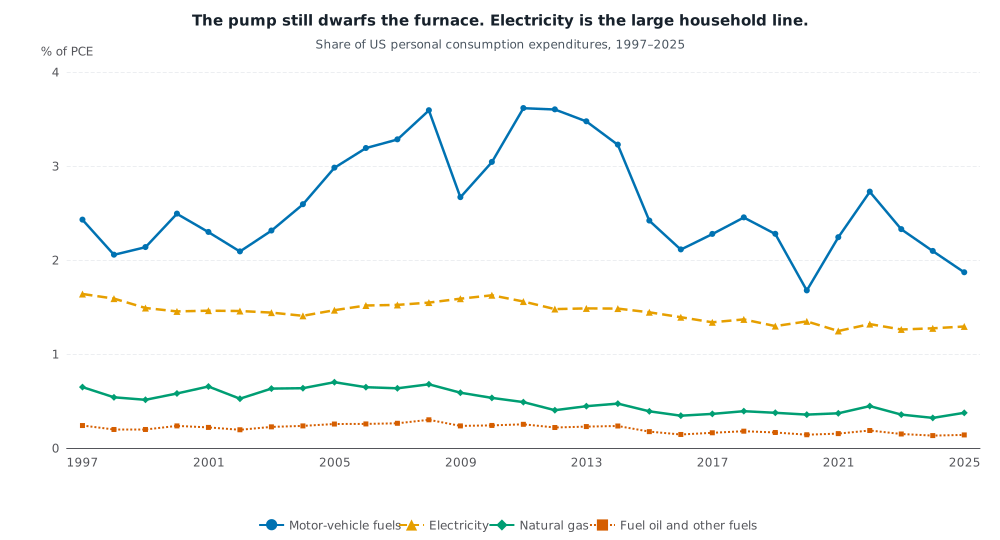
Each series as a percent of US personal consumption expenditures, calendar years 1997–2025, current dollars. Source: BEA, SAPCE4 function table, United States. Shares move with both prices and quantities; fuel oil and other fuels includes heating oil plus other solid and liquid household fuels, not only diesel.
The long view is the same picture with more weather. Motor fuels are the volatile slice. Electricity is the large, sticky household energy bill. Natural gas moves with the industrial-price cycle but never approaches the pump. Heating oil has been shrinking as a share of spending for a generation. A global diesel squeeze can still matter for trucking, farmers, and the few households that burn distillate. It is not, in these accounts, the American household energy problem.
The 2025 gas jump was national
This is not a one-state quirk. Natural-gas PCE rose in 2025 in every state and the District of Columbia. The smallest increase was 16.8% in the District of Columbia; the largest was 38.5% in Nevada. Cold-weather heating states and warm-weather states both spent more. The BEA figures cannot say how much of that was higher prices, a colder year, or more gas burned. They can say the increase was broad.
What a household ledger cannot settle
A diesel bargain can still lower trucking costs, farm fuel, and wholesale distillate — none of which dominate household PCE. Current-dollar spending is not a price index and not a physical quantity. The 2025 calendar year is not the winter now starting, and it cannot verify European gas-storage warnings or a $105 print on a single October day. Household "fuel oil and other fuels" is not identical to heating oil, let alone to diesel.
The useful correction is narrower. Policymakers reached for a liquid-fuel deal as if the household pain were still the 2022 pump shock. In the books through 2025, that shock had already faded. The energy bill that had come back was natural gas, and the energy bill that never came down was electricity.
Sources and methods
This article is retrospective research. The news it is written against is from 9 October 2026; the calculations use a BEA state PCE snapshot released 30 September 2026 (research date 10 October 2026). Figures are annual, current-dollar PCE for the United States from BEA table SAPCE4, converted from millions to billions by dividing by 1,000. Shares use the same table's total PCE as the denominator. State confirmation uses the 50 states plus the District of Columbia in that snapshot. 2025 is the latest complete calendar year in the release, not a forecast and not proof of what households will spend this winter.
Research Date
The displayed date matches the related news edition. Research was completed 2026-10-10.
Related news: Daily · 2026-10-09
More Research
Restaurant Output Has Been Shrinking For Three Years. The Checks Have Not.
U.S. household spending on restaurant meals kept rising through 2025 while real food-services output fell for three years — the pattern behind claims that weight-loss drugs are rewriting din
Brazil Still Runs On Rain. A Record El Niño Is About To Test How Much Less It Used To
The UN's World Meteorological Organization expects the current El Niño — already described as possibly the strongest in at least 76 years — to keep intensifying to a peak in…
California Still Pays More. Housing Takes Most Of The Difference Back.
California still out-earns Texas, even after prices. Tenant housing is 60 percent more expensive, and Texas has been adding the jobs.