LunarWeave
Restaurant Output Has Been Shrinking For Three Years. The Checks Have Not.
American restaurants are being told they have a new rival in the booth: appetite. Reporting in early October described diners on Wegovy, Ozempic and Zepbound eating less, boxing leftovers and leaving smaller bills, and it treated that shift as a rewrite of U.S. gastronomy. If those drugs were already shrinking what people consume away from home, the national accounts should show it in restaurant volumes.
They show something narrower, and more awkward for the “smaller expenses” version of the story. Households spent $1.26 trillion on purchased meals and beverages in 2025, 21.8 percent more than in 2022, according to the Bureau of Economic Analysis’s state personal consumption accounts. Over the same three years, real output of food services and drinking places — restaurants, bars and other eating places, measured as value added in chained 2017 dollars — fell 2.2 percent, to $451.4 billion. The rest of the U.S. economy grew 8.4 percent.
That combination is what a quieter dining room with a more expensive menu would look like in official data. It is not proof that GLP-1 drugs caused it.
Dollars up, plates down
Purchased meals and beverages are the BEA’s household-spending series for food away from home. The figures are in current dollars, so they mix price and quantity. They have set a new high every year since the 2020 collapse: $818.1 billion in 2019, $1.03 trillion in 2022, $1.26 trillion in 2025 — a 53.8 percent rise from the last pre-pandemic year.
The industry’s real output did not follow the check. Food-services-and-drinking-places real GDP recovered from a pandemic trough of 75.6 percent of its 2019 level in 2020 to a modest peak of $461.4 billion in 2022, just 0.8 percent above 2019. It then slipped for three consecutive years. By 2025 it was 1.4 percent below 2019. BEA’s chain-type quantity index for the same industry (2017 = 100) tells the same story: 104.6 in 2022, 102.3 in 2025.
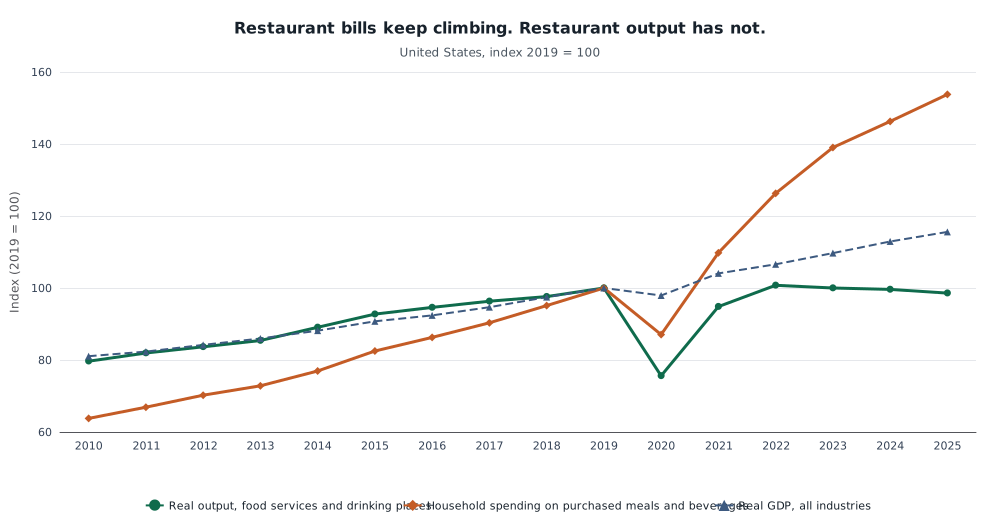
United States, 2010–2025, index 2019 = 100. Real restaurant output is BEA real GDP of food services and drinking places in chained 2017 dollars. Household spending is BEA personal consumption expenditures on purchased meals and beverages in current dollars. All-industry real GDP is the comparison series. Current-dollar spending is not a volume measure; 2020 is the pandemic crash. Source: U.S. Bureau of Economic Analysis, SAPCE and SAGDP, 2026-09-30 release.
The implied price of that output rose sharply. Dividing the industry’s current-dollar GDP by its real GDP produces a value-added deflator that is 46.7 percent higher in 2025 than in 2019. Nominal industry GDP still climbed 20.5 percent from 2022 to 2025, to $708.9 billion, even as real output contracted. Americans were paying more for less restaurant production.
They were not simply moving the grocery budget around. Spending on food and beverages purchased for off-premises consumption — the grocery-and-package-store counterpart — rose 9.3 percent from 2022 to 2025, less than half as fast as restaurant bills. Purchased meals’ share of those two food-and-beverage categories combined went from 43.0 percent in 2019 to 45.2 percent in 2025. As a slice of all personal consumption, meals moved from 5.7 percent to 6.0 percent. The dollar share of dining out is higher than before the pandemic. The real output is not.
| Measure | 2019 | 2022 | 2025 | 2022–25 |
|---|---|---|---|---|
| Purchased meals and beverages (current $ bn) | 818.1 | 1,033.1 | 1,258.0 | +21.8% |
| Real GDP, food services and drinking places (chained 2017 $ bn) | 457.9 | 461.4 | 451.4 | −2.2% |
| Real GDP, all industries (chained 2017 $ bn) | 20,716 | 22,080 | 23,943 | +8.4% |
| Meals’ share of food-and-beverage PCE | 43.0% | 42.6% | 45.2% | +2.6 pp |
A national slide, not a uniform one
The post-2022 decline is national, but it is not the same in every large state. California’s real restaurant output is 8.1 percent below 2019 and 2.5 percent below 2022. Florida is still 9.4 percent larger than in 2019, yet 1.5 percent smaller than in 2022. Texas is roughly flat with 2019 and down 1.1 percent from 2022. New York is the exception among the four: it kept recovering through 2024 and was 2.3 percent above 2022 in 2025, though still 2.2 percent short of 2019.
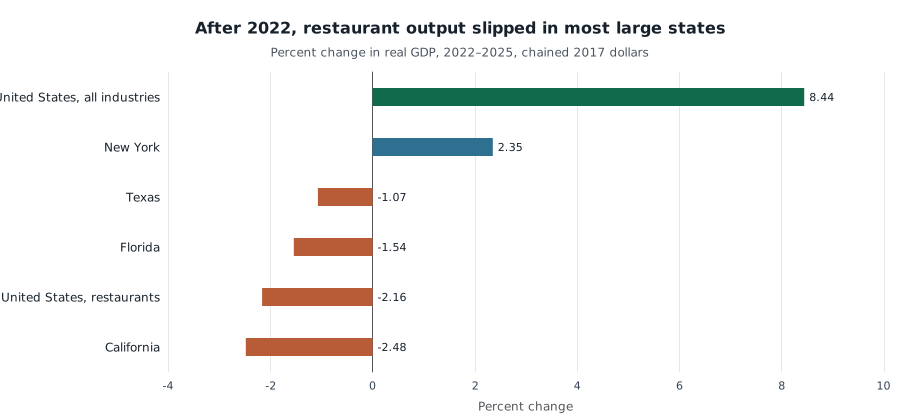
Percent change in real GDP, 2022–2025, chained 2017 dollars. Restaurant bars are food services and drinking places. New York is still climbing out of a deeper 2020 collapse. This is industry value added, not covers or employment. Source: U.S. Bureau of Economic Analysis, SAGDP, 2026-09-30 release.
Payrolls in those states do not look like a mass restaurant recession. BLS state and area employment counts, not seasonally adjusted and compared in August to avoid the summer swing, show California food-services-and-drinking-places jobs at 1.490 million in August 2026 versus 1.485 million in August 2019. Texas rose 11.3 percent over that span, to 1.257 million. New York was still 2.2 percent below August 2019. Headcounts can stay up while real value added slips if hours are shorter, tickets are smaller, or more labor is needed to produce less output. The employment series cannot distinguish those.
What the accounts cannot say
None of this isolates Wegovy, Ozempic or Zepbound. BEA does not publish a GLP-1 spending line, and real restaurant GDP is value added — sales minus intermediate inputs — not a count of meals, calories or covers. A three-year decline after a 2022 peak is also consistent with menu inflation, shorter hours, a shift in the mix of establishments, lingering pandemic habits, or weaker walk-in traffic that has nothing to do with weight-loss drugs. The iDNES report that guests eat less and pack more leftovers is a plausible micro story. It is not a measured national total.
What the official series do rule out is simpler. Through 2025, the United States had not entered an era of shrinking restaurant bills. Households were spending a larger share of their food-and-beverage money on meals away from home, at higher implied prices, while the industry produced less in real terms than it did three years earlier — and less than it did in 2019 — against an economy that was still expanding. If appetite-suppressing drugs are rewriting American dining, that is the shape the rewrite has in the books so far: not a cheaper night out, but a smaller real restaurant sector underneath a larger check.
Sources and methods
This article is retrospective research written on 11 October 2026, using pinned dataset snapshots available at research time. It is not an as-of reconstruction of what was knowable on 10 October 2026. BEA SAPCE personal consumption and SAGDP GDP-by-state figures are annual, through 2025, from the 30 September 2026 regional releases. BLS state employment is monthly through August 2026. Real GDP is in millions of chained 2017 dollars; PCE is in millions of current dollars. Food services and drinking places is NAICS 722. Purchased meals and beverages is the BEA PCE function line for food away from home; it is not the same as industry GDP. Percentages are calculated from the saved extracts. SVG rendering is not a substitute for browser or mobile layout review.
Research Date
The displayed date matches the related news edition. Research was completed 2026-10-11.
Related news: Daily · 2026-10-10
More Research
California Still Pays More. Housing Takes Most Of The Difference Back.
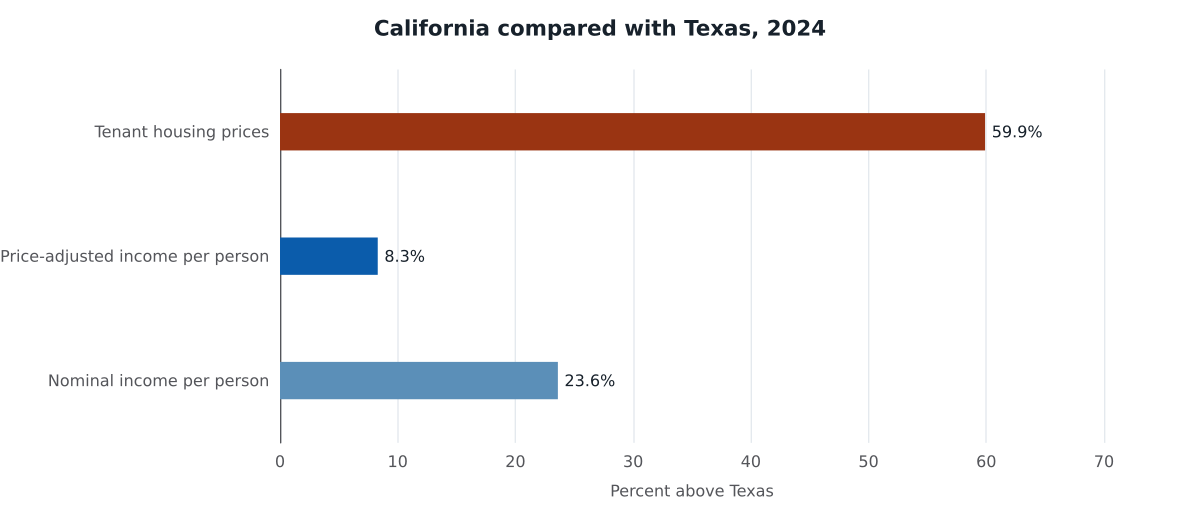
California still out-earns Texas, even after prices. Tenant housing is 60 percent more expensive, and Texas has been adding the jobs.
The Household Energy Spike That Returned Was The Gas Bill, Not The Pump
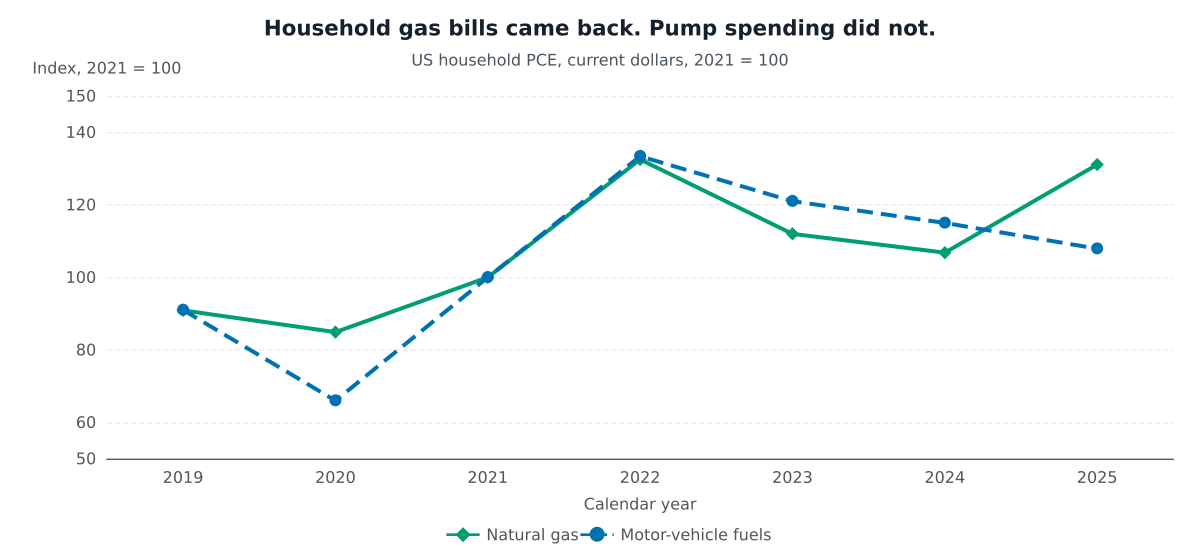
US household natural-gas spending returned to its 2022 level in 2025, while motor-fuel spending kept falling — a mismatch with a diesel bargain aimed at the pump.
The Diesel Squeeze Is A Power-Plant Story — But Only In Some Gulf Grids
Saudi Arabia, Kuwait and Iraq still generate about two-fifths to half their electricity from oil. The UAE and Qatar do not. That split, not a generic Gulf shortage, is the structural claim o