LunarWeave
California Still Pays More. Housing Takes Most Of The Difference Back.
When young adults leave California for Texas, the usual story writes itself: the richer coastal state has priced itself out of its own future. In October 2026, Infobae reported Census Bureau figures putting a number on that story — California lost 58,109 residents from the 1997–2012 birth cohort in 2024, with nearly 20,000 of them moving to Texas. Those Census counts are not in the official time series used here and are treated as reported, not re-tabulated.
The economic question is still worth asking. Has California actually fallen behind Texas as a place to earn a living, or are people moving even though the average Californian remains better paid once prices are counted?
The Bureau of Economic Analysis state accounts give a clear, slightly awkward answer. California still out-earns Texas. After the Bureau’s own regional price adjustment, the lead is much smaller than the paycheck gap. The price that has not closed is rent.
The paycheck is still larger
In 2024, California’s personal income per person was $86,761. Texas’s was $70,185. That is a 23.6 percent nominal lead, and it had not faded by 2025, when the gap was 24.3 percent ($90,957 versus $73,156).
A smaller share of that California income arrives as spending money. Disposable personal income — personal income minus personal current taxes — was $74,152 per person in California and $63,601 in Texas in 2024. The remaining California lead is 16.6 percent. Personal current taxes, which mix federal, state and local levies, took 14.5 percent of California personal income and 9.4 percent of Texas personal income. That is not a statutory tax rate, and it is not a young renter’s withholding table. It is the average bite in the state accounts.
Rent, not groceries, is the wedge
Prices do more of the work than taxes. In 2024, California’s all-items regional price parity was 110.72, meaning a representative basket cost 10.7 percent more than the national average. Texas’s was 97.057, or 2.9 percent below. California was 14.1 percent more expensive than Texas overall.
Goods were not the problem. California’s goods RPP was only 8.2 percent above Texas. Housing was. The Bureau’s housing parities estimate tenant-occupied housing, which is the price a mover without a locked-in mortgage actually faces. In 2024 that index was 154.346 in California and 96.503 in Texas — 59.9 percent higher in California, and 53.4 percent above the national housing index.
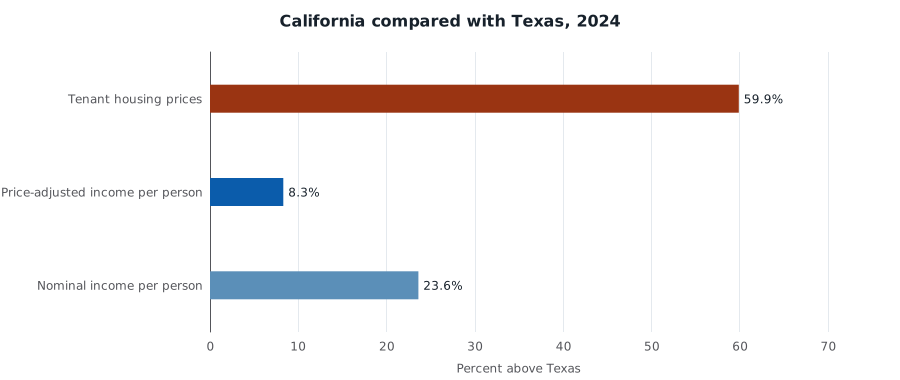
California’s 2024 advantage over Texas, percent. Nominal and price-adjusted figures are BEA per capita personal income (current dollars versus constant 2017 dollars). Tenant housing prices are BEA housing regional price parities. Statewide averages are not age-specific. Source: U.S. Bureau of Economic Analysis.
The housing gap is old. It has not been exploding. In 2008 California tenant housing was 83.4 percent above Texas; by 2024 the gap had narrowed to 59.9 percent as Texas’s housing index rose and California’s eased from its 2020 peak. A narrower gap is still a chasm if you are paying this year’s rent.
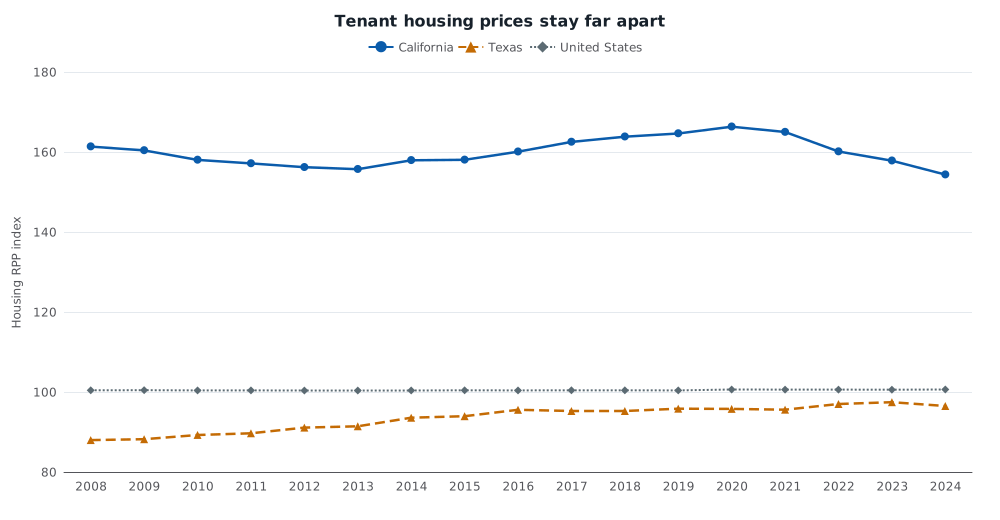
BEA housing regional price parities, 2008–2024. The index is scaled so the United States all-items RPP equals 100 each year; the U.S. housing component need not equal 100. Housing price levels are estimated for tenant-occupied housing. Source: U.S. Bureau of Economic Analysis.
The average consumption basket does not advertise that rent shock. Housing and utilities were 19.0 percent of California personal consumption expenditures per person in 2024 and 18.2 percent in Texas. Californians spend more dollars on housing because they spend more dollars on everything. Owner-occupiers, whose housing cost in these accounts is an imputed rent, pull that average down relative to a new tenant.
Texas used to be ahead in real income
Once the Bureau converts personal income into constant 2017 dollars using those parities, California’s 2024 lead over Texas shrinks from 23.6 percent to 8.3 percent ($63,028 versus $58,219). California is also 6.5 percent above the national real figure of $59,195. Real consumption per person tells the same story: California residents still consumed 9.6 percent more than Texans in 2017 dollars.
That remaining lead is recent. From 2008 through 2014, Texas had higher real income per person. In 2008 the Texas advantage was 5.2 percent ($46,068 versus $43,788). California overtook Texas in 2015. The gap peaked at 12.8 percent in 2020, then narrowed, then widened again to 8.3 percent in 2024.
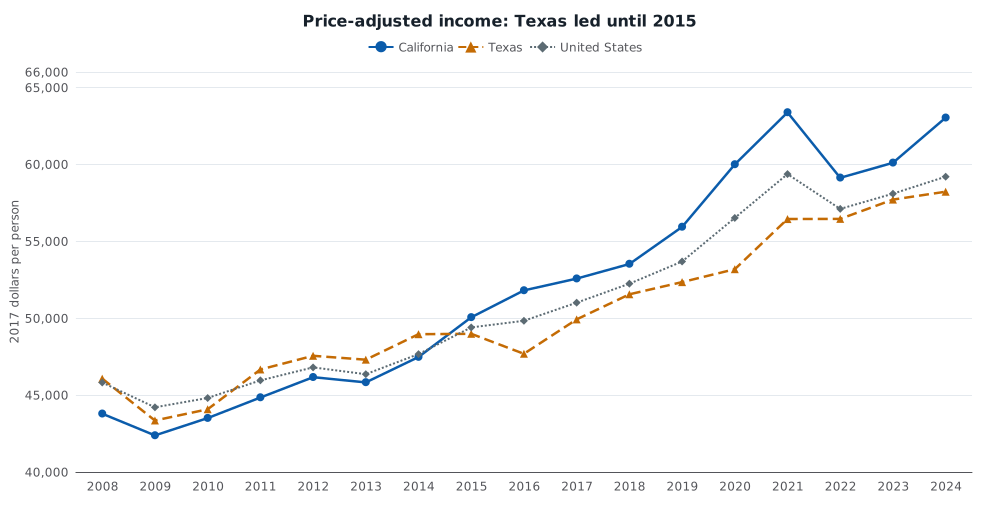
BEA real per capita personal income, constant 2017 dollars, 2008–2024. Real personal income already incorporates regional price parities. Source: U.S. Bureau of Economic Analysis.
The average Californian did not become poorer than the average Texan. The average also hides who faces the tenant housing index without a Bay Area equity gain or a paid-off house.
The jobs and the people went to Texas anyway
If income were the whole story, California would still be pulling people in. It has not been.
Seasonally adjusted total nonfarm payrolls rose 712,100 in California from August 2019 to August 2026, or 4.1 percent. Texas added 1,607,500 jobs, or 12.5 percent, from a smaller base. By August 2026 California still had more jobs — 18.18 million against 14.47 million — but the hiring was elsewhere.
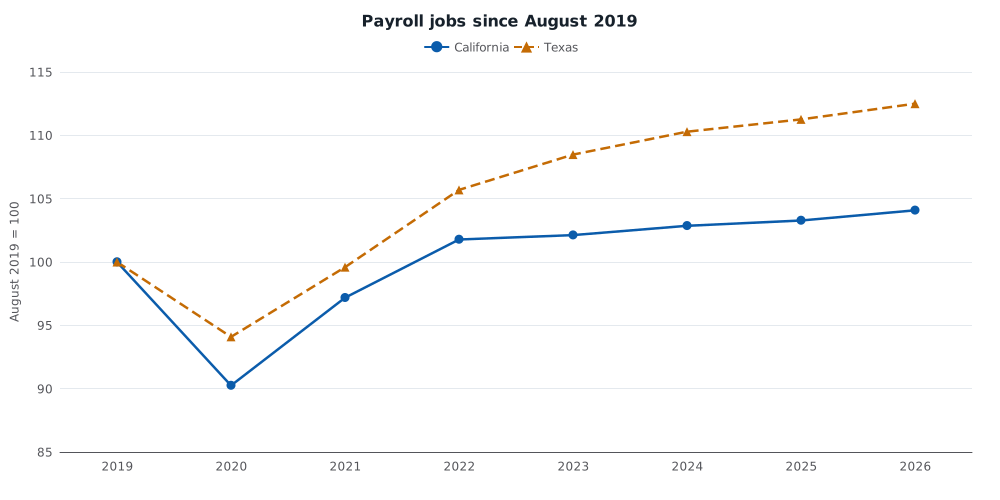
BLS statewide total nonfarm payrolls, August of each year, seasonally adjusted, indexed to August 2019 = 100. Indexing compares growth, not the larger California job count. Source: U.S. Bureau of Labor Statistics.
Population followed. Using the midyear counts the BEA pairs with personal income, California had 39.55 million residents in 2019 and 39.36 million in 2025, a loss of 192,686 people (−0.5 percent). Texas grew from 28.86 million to 31.71 million, a gain of 2.85 million (+9.9 percent). Since 2008 Texas has added 7.40 million people; California has added 2.75 million.
That statewide population path does not confirm a 2024 Generation Z exodus. California’s 2024 midyear population rose by 183,107 from 2023. If the reported cohort outflow happened, other people arrived in larger number. Age-specific migration is exactly what these series cannot show.
| Measure | California | Texas | CA vs TX |
|---|---|---|---|
| Personal income per person, 2024 | $86,761 | $70,185 | +23.6% |
| Real personal income per person, 2024 (2017 $) | $63,028 | $58,219 | +8.3% |
| All-items RPP, 2024 (US = 100) | 110.7 | 97.1 | +14.1% |
| Housing RPP, 2024 (tenant-occupied) | 154.3 | 96.5 | +59.9% |
| Goods RPP, 2024 | 106.1 | 98.1 | +8.2% |
| Payroll jobs, Aug 2019–Aug 2026 | +712,100 | +1,607,500 | — |
| Population, 2019–2025 | −192,686 | +2,853,366 | — |
The implication for a reported youth move is not that California has lost its income advantage. It is that the advantage, after prices, is modest; the rent gap a new tenant faces is not; and Texas has been the growth state for jobs and residents for years. Statewide averages cannot say whether a 24-year-old software worker and a 24-year-old renter in Fresno are looking at the same bargain. They can say the bargain is not “Texas now pays more.”
Methods and sources
This is retrospective research completed on 12 October 2026, after the 11 October 2026 news reports. It uses pinned BEA and BLS snapshots available at research time, not an as-of reconstruction of what was knowable that day. Regional price parities and official real personal income run through 2024 (BEA release identified as bea-rpp-2026-02-19). Nominal income, disposable income, population and state PCE run through 2025. Payroll employment runs through August 2026.
RPPs are spatial indexes with the United States all-items index equal to 100 in each year; a change in a state’s RPP is not that state’s inflation rate. Real personal income is the official BEA series in constant 2017 dollars. Personal current taxes are inferred as personal income minus disposable personal income. Missing values are not treated as zero. No series here is age-specific, so the analysis cannot verify the reported Generation Z counts or prove why any person moved.
Sources: BEA Regional Price Parities and Real Personal Income; BEA Personal Income by State; BEA PCE by State; BLS State and Area Employment. Reported Census figures as carried by Infobae.
Research Date
The displayed date matches the related news edition. Research was completed 2026-10-12.
Related news: Daily · 2026-10-11
More Research
The Diesel Squeeze Is A Power-Plant Story — But Only In Some Gulf Grids
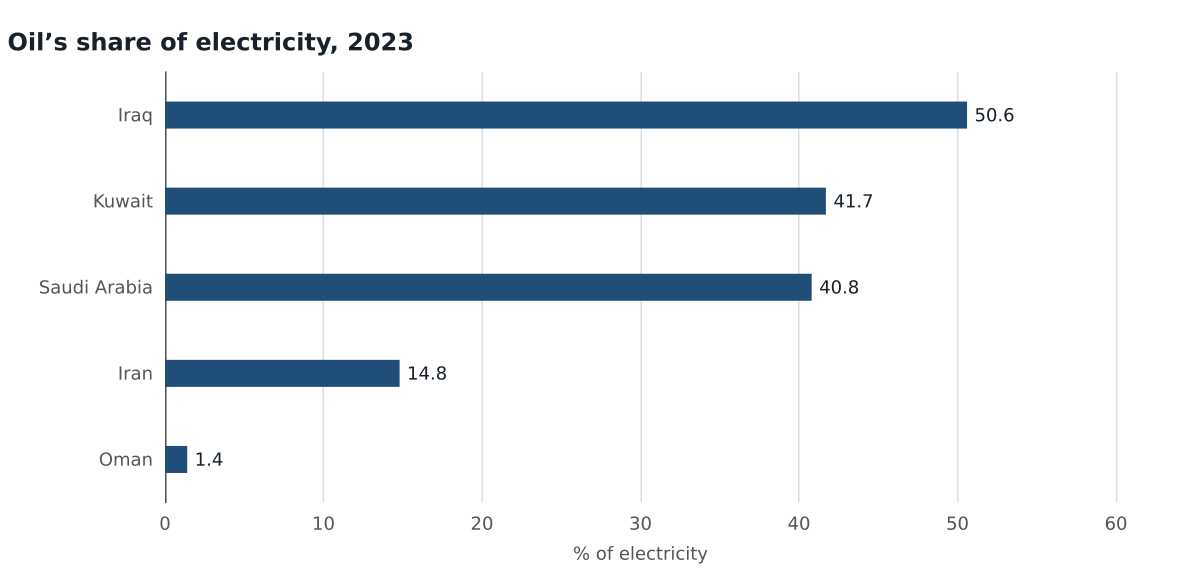
Saudi Arabia, Kuwait and Iraq still generate about two-fifths to half their electricity from oil. The UAE and Qatar do not. That split, not a generic Gulf shortage, is the structural claim o
Restaurant Output Has Been Shrinking For Three Years. The Checks Have Not.
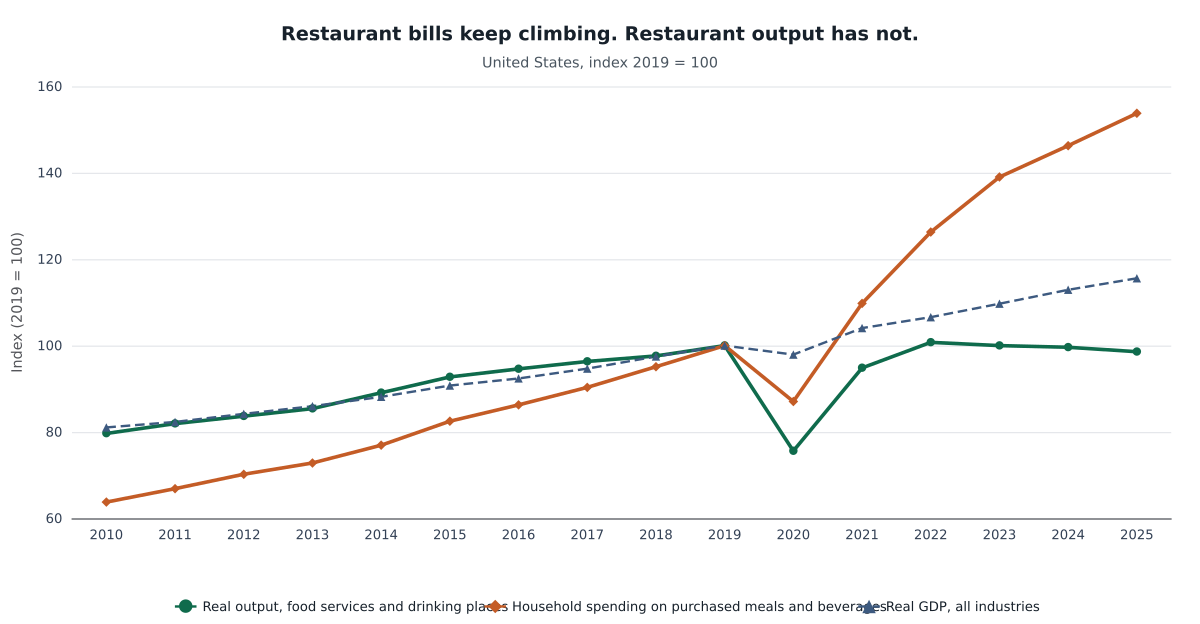
U.S. household spending on restaurant meals kept rising through 2025 while real food-services output fell for three years — the pattern behind claims that weight-loss drugs are rewriting din
Yemen's Electricity Already Runs On Oil
IRENA generation data show oil supplied 88.8% of Yemen's electricity in 2023 after gas-fired output collapsed, versus 40.8% in Saudi Arabia and 14.8% in Iran.