LunarWeave
America’s Hosting-And-Search Industry Is Already 2 Percent Of GDP. That Is Not A Map Of Data Center Alley.
Bond investors spent the middle of October marking down a data-center operator whose liabilities, reported at $72 billion across 51 sites, now carry default odds above 60 percent. The comparison making the rounds — a leveraged middleman that buys chips, rents halls, and sublets computing time — is meant to sound like WeWork with GPUs. The fear underneath is larger: that the AI build-out was financed faster than it can earn.
The national accounts cannot price CoreWeave’s bonds. They can answer a more basic question. How large is the official U.S. industry that hosts, processes and searches the internet, how capital-heavy has it become, and does that output sit where the server campuses are?
It is already large. In 2025, Bureau of Economic Analysis “data processing, hosting, and other information services” produced $596.0 billion of current-dollar value added, 1.93 percent of U.S. GDP. That is no longer a niche trade. It is also not a pure AI data-center series. BEA’s own definition of the NAICS 518–519 grouping covers establishments that provide internet access, internet search, and data processing and hosting. Google’s search business and a Northern Virginia colocation hall live in the same published line.
That mixing is the point, not a footnote. If the closest official industry is already approaching 2 percent of the economy, a financing scare in digital infrastructure is a real-economy story. If most of the value added is search and cloud software booked on the coasts, a bust at a leveraged hall operator is a different, narrower story. Both things can be true at once.
A boom that was running before ChatGPT
Real output in the industry — chained 2017 dollars — rose 143 percent from 2019 to 2025. All-industry U.S. real GDP rose 16 percent over the same years. The acceleration did not begin in late 2022. The 2019–indexed series was already at 162 in 2022, then 243 in 2025.
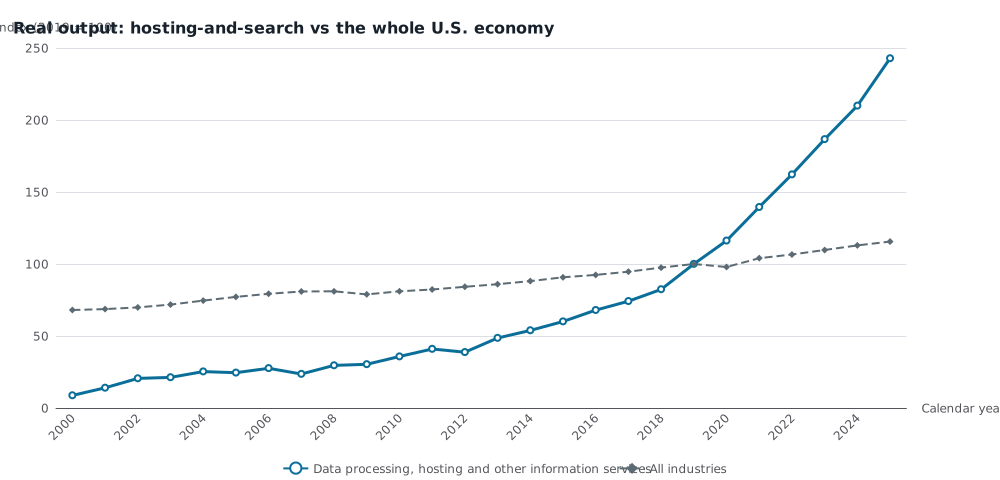
Real GDP indexed to 2019 = 100. The industry series is BEA “data processing, hosting, and other information services” (NAICS 518–519), which mixes internet search, internet access, data processing and hosting; it is not a pure AI data-center measure. United States, calendar years 2000–2025, chained 2017 dollars. Source: U.S. Bureau of Economic Analysis, GDP by state, September 30, 2026 release.
In 2025 the industry’s real output rose 15.7 percent. The whole economy rose 2.3 percent. BEA’s published contribution table credits the industry with 0.27 percentage points of that 2.3 percent — about one-ninth of U.S. real growth last year. A sector that was 0.27 percent of GDP in 2000 and 1.27 percent in 2019 is now large enough to move the national growth rate.
None of that isolates AI training clusters. It does show that the digital-infrastructure-and-search complex was compounding at a rate the rest of the economy has not matched, and that the compounding continued through 2025, the last calendar year in this release.
Pay is no longer the larger slice
Value added in the industry now looks like a capital account with a payroll attached. In 2025, gross operating surplus was $330.1 billion, 55.4 percent of industry GDP. Compensation of employees was $256.7 billion, 43.1 percent. Taxes on production and imports less subsidies filled the remaining $9.2 billion. Those three pieces sum to the $596.0 billion GDP total within $1 million.
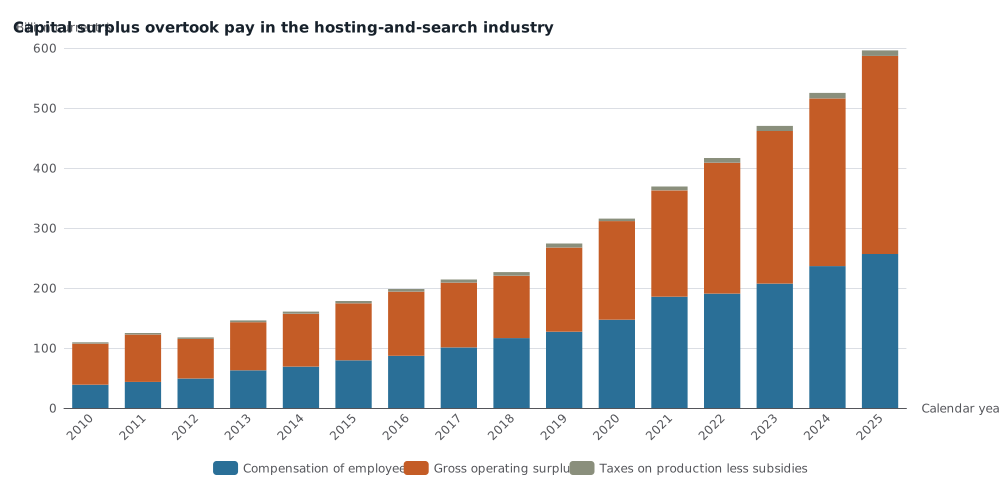
United States, 2010–2025. Components of current-dollar GDP in data processing, hosting, and other information services: compensation of employees, gross operating surplus, and taxes on production and imports less subsidies. Components are converted from thousands of dollars; they reconcile to industry GDP within $1 million. Source: U.S. Bureau of Economic Analysis, GDP by state, September 30, 2026 release.
Surplus is not “profit” in a bond-covenant sense. It is the residual after labor and net production taxes: consumption of capital, business income, and the return to capital more broadly. A surplus share above compensation is what a capital-intensive platform industry is supposed to look like. It is also why a debt scare can matter even when headcount does not: the accounts are already treating this industry as a machine for generating capital income, not as a large employer relative to its GDP.
A reported $72 billion liability book is 12 percent of one year of this industry’s value added, or 22 percent of one year of its surplus. That is a scale comparison, not a leverage ratio. GDP is a flow; the $72 billion is a reported stock, and it belongs to one company inside a much broader industry. The comparison only shows that the number being marked down is no longer small beside the official sector.
California books the output. Virginia runs the campuses.
If the boom were mainly a story of server halls, Northern Virginia would dominate the map. It does not.
In 2025 California alone accounted for $229.2 billion, 38 percent of U.S. industry GDP and 5.33 percent of California’s own economy. Washington’s slice is smaller in dollars — $56.7 billion — but larger as a share of the state: 6.36 percent of Washington GDP, up from 3.19 percent in 2019, with real output up 227 percent over those six years. New York contributed $73.1 billion, 2.96 percent of state GDP.
Virginia, the usual shorthand for Data Center Alley, produced $14.4 billion. That is 1.78 percent of Virginia’s GDP — a touch below the national 1.93 percent share. The industry has grown quickly there (real output up 154 percent since 2019). It has not made Virginia unusually specialized in the published accounts.
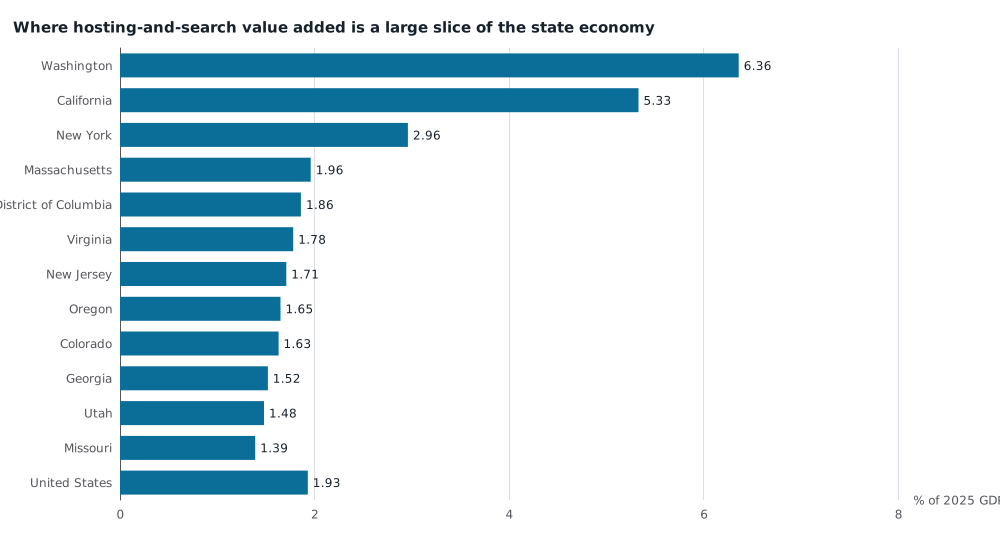
Industry current-dollar GDP as a percent of that geography’s all-industry GDP in 2025. Top 12 states plus the United States. Same NAICS 518–519 industry as the national charts; search and cloud software value added can be booked where establishments sit, not where server halls are. Source: U.S. Bureau of Economic Analysis, GDP by state, September 30, 2026 release.
The top ten states by industry GDP hold 80 percent of the U.S. total. That concentration is a coastal software-and-search map, not a map of cheap power and dark fiber.
| Geography | 2025 industry GDP | Share of local GDP | Real growth, 2019–25 |
|---|---|---|---|
| United States | $596.0 billion | 1.93% | 143% |
| California | $229.2 billion | 5.33% | 127% |
| New York | $73.1 billion | 2.96% | 136% |
| Washington | $56.7 billion | 6.36% | 227% |
| Texas | $26.4 billion | 0.90% | 150% |
| Virginia | $14.4 billion | 1.78% | 154% |
BEA state GDP is an establishment measure: value added where production is recorded, not where a company’s headquarters plaque hangs, and not where every server rack sits. Search, advertising and cloud software can still be booked in California and Washington even when the electricity is burned in Loudoun County. The accounts are doing what they are designed to do. They are a poor atlas of raised floors.
What the debt scare can and cannot take from this
The official industry that includes hosting is no longer a rounding error. It is approaching 2 percent of U.S. GDP, it supplied about a ninth of 2025 real growth, and more than half of its value added is capital surplus rather than pay. A financing freeze that hit the whole complex would be a macro event.
That is not the same as saying CoreWeave is the complex. The published line cannot split GPU colocation from search portals. The geography of value added does not match the geography of data-center campuses. GDP is not a debt stock, 2025 is the last calendar year in this release — not October 2026 — and later revisions can move recent years. The bond market is pricing a leveraged middleman. The national accounts are describing a large, surplus-heavy, coastally concentrated digital industry that was already compounding before generative AI had a ticker.
Both pictures matter. Confusing them is how a 51-site borrower gets mistaken for 2 percent of America, or how a 2 percent industry gets dismissed as a handful of sheds in the Piedmont.
Methods and sources
This article is retrospective research completed on 19 October 2026, using pinned BEA snapshots available then. It is not an as-of reconstruction of what was knowable on the 18 October 2026 news day.
Figures come from the U.S. Bureau of Economic Analysis GDP by state tables in the 30 September 2026 annual release (bea-regional-state-annual-2026-09-30), covering calendar years through 2025. Current-dollar GDP is millions of dollars; real GDP is millions of chained 2017 dollars. Compensation, gross operating surplus, and taxes less subsidies are published in thousands of dollars and converted to millions here. Industry real GDP is chain-weighted and is not additive across states or industries; national growth uses the U.S. series, not a sum of states. Contributions to percent change are BEA’s published percentage-point contributions to all-industry real GDP growth.
The industry is BEA “Data processing, hosting, and other information services” (NAICS 518–519). BEA describes it as establishments that provide internet access, search facilities for the internet, and data processing, hosting, and related services. It is not a census of AI training clusters. CoreWeave’s $72 billion of liabilities and default-odds figure are reported claims from contemporary coverage, not BEA statistics. Methodology: BEA regional economic accounts.
Research Date
The displayed date matches the related news edition. Research was completed 2026-10-19.
Related news: Daily · 2026-10-18
More Research
America’s Auto Plants Are Producing More. Michigan’s Factories Are Not Hiring.
US motor-vehicle manufacturing output is 36 percent above 2019. Auto-state factory jobs are mixed: Michigan is down, Texas and the South are not.
Cuba Still Has An Oil-Fired Grid. It Has Stopped Getting Electricity Out Of It.
Cuba's October blackout hit an oil-fired grid that had already lost nearly a third of its electricity since 2018 while keeping most plants on the books.
$110 Oil Is A Power-Bill Shock In Only A Few Grids
IRENA accounts show oil-fired electricity falling to 2.4 percent of world generation by 2023, with the remaining kilowatt-hours concentrated in Saudi Arabia, Iraq, Kuwait and Iran.