LunarWeave
America’s Auto Plants Are Producing More. Michigan’s Factories Are Not Hiring.
Volkswagen is weighing a wage freeze for most of its 600,000 workers through 2030. The same week, a Munich Ifo Institute study circulated in the European press found that German industry had shed 496,000 jobs — 7.1 percent — from the start of 2019 to the end of last year, with automobiles hit worst. Those are reported claims, not figures this article can audit. They do pose a measurable question: if factory work is collapsing across the rich world’s car economies, has the United States already followed?
It has not, at least not as an output story, and not as a uniform jobs story.
Auto output is larger than before the pandemic
The Bureau of Economic Analysis publishes real GDP for motor vehicles, bodies and trailers, and parts manufacturing (NAICS 3361–3363). In 2019 that industry produced $167.3 billion of output in chained 2017 dollars. In 2025 it produced $227.6 billion — 36.1 percent more. The 2020 shutdown cut the figure to $148.4 billion. By 2022 it was already $218.9 billion, and 2025 is the high point in the 2007–2025 annual series.
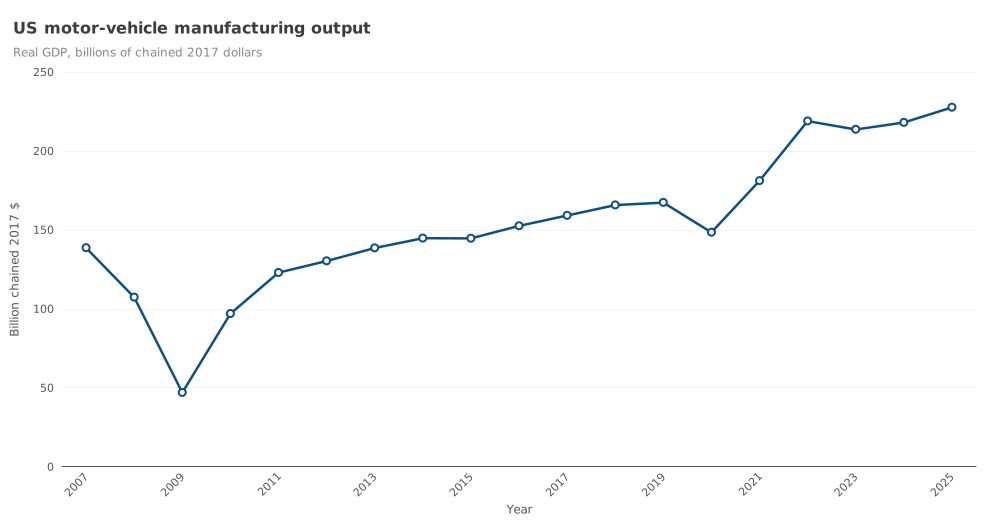
Real GDP of US motor vehicles, bodies and trailers, and parts manufacturing, billions of chained 2017 dollars, 2007–2025. Industry chain-weighted totals are not additive with other industries. Source: U.S. Bureau of Economic Analysis, GDP by state, 30 September 2026 release.
All manufacturing real GDP rose 8.6 percent over the same 2019–2025 span, and economy-wide real GDP rose 15.6 percent. Auto plants expanded faster than factories in general. That is not proof that every assembly line is healthy, and chained-dollar industry accounts cannot be stacked into a tidy “share of manufacturing.” It is proof that the United States is not living through a 2009-style auto-output collapse. In 2009 the same industry’s real GDP was $46.9 billion.
Michigan is making more cars with fewer factory workers
The jobs picture in the old auto belt is bleaker, and it is not the same as the output picture.
Michigan’s seasonally adjusted manufacturing payrolls, from the Bureau of Labor Statistics’ State and Area Employment program, were 628,900 in January 2019 and 583,300 in August 2026 — 45,600 fewer jobs, a 7.3 percent drop. That percentage is uncomfortably close to the reported German industry decline. It is not a statewide jobs depression: Michigan’s total nonfarm payrolls rose 1.3 percent over the same months, and manufacturing’s slice of those payrolls slipped from 14.2 percent to 13.0 percent.
Michigan’s auto plants, meanwhile, produced more. The state’s motor-vehicle manufacturing real GDP rose from $38.0 billion in 2019 to $50.2 billion in 2025, a 32.2 percent increase. Indexed to 2019, national auto output and Michigan factory employment moved together through the 2020 crash and then diverged. By 2025, US auto real GDP was 36.1 percent above 2019; Michigan’s average monthly manufacturing payroll was 6.6 percent below.
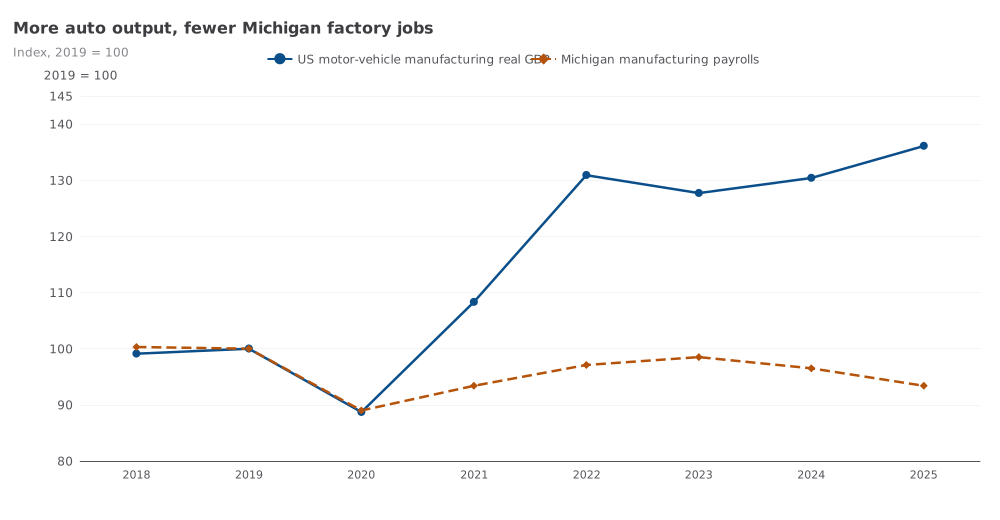
Index, 2019 = 100. The US series is annual real GDP of motor-vehicle manufacturing. The Michigan series is the annual average of monthly seasonally adjusted manufacturing payrolls, which include factories besides vehicle plants. Sources: BEA; BLS SAE.
That wedge is the useful fact for a wage freeze. A company can be under cost pressure even while the country’s auto output is rising, if the extra output is coming from other states, from more output per worker, or from both.
The jobs loss is a Midwest story, not an auto-state story
Statewide manufacturing payrolls are broader than auto plants. They are still the cleanest recent employment series for the states that actually build cars, and they do not show a uniform collapse.
| State | Manufacturing jobs, Jan 2019 (000s) | Aug 2026 (000s) | Job change | Auto-plant real GDP, 2019–2025 |
|---|---|---|---|---|
| Michigan | 628.9 | 583.3 | −7.3% | +32.2% |
| Indiana | 544.6 | 516.9 | −5.1% | +23.0% |
| Ohio | 703.4 | 688.3 | −2.1% | +3.3% |
| Kentucky | 252.8 | 249.8 | −1.2% | +34.6% |
| Tennessee | 355.0 | 354.4 | −0.2% | −3.3% |
| South Carolina | 255.7 | 266.0 | +4.0% | +27.3% |
| Alabama | 269.5 | 281.9 | +4.6% | +39.5% |
| Texas | 897.5 | 982.8 | +9.5% | +125.1% |
Payrolls: seasonally adjusted statewide manufacturing all-employees, BLS SAE. Auto-plant GDP: motor vehicles, bodies, trailers and parts, millions of chained 2017 dollars converted here to percent change, BEA. Chain-weighted state industry figures should not be added together.
Together, those eight states employed 3.907 million manufacturing workers in January 2019 and 3.923 million in August 2026 — 16,000 more, or 0.4 percent. Strip out Texas, whose factories make far more than cars, and the remaining seven are down 69,300 jobs, or 2.3 percent. That is a grind, not a German-scale wipeout.
Texas is the outlier on both measures. Its motor-vehicle manufacturing real GDP more than doubled, from $15.5 billion in 2019 to $35.0 billion in 2025. Alabama, Kentucky and South Carolina also posted large auto-output gains with manufacturing payrolls that held or rose. Ohio’s auto output is only 3.3 percent above 2019; Tennessee’s is 3.3 percent below. The geography of American car making shifted south and west. It did not disappear.
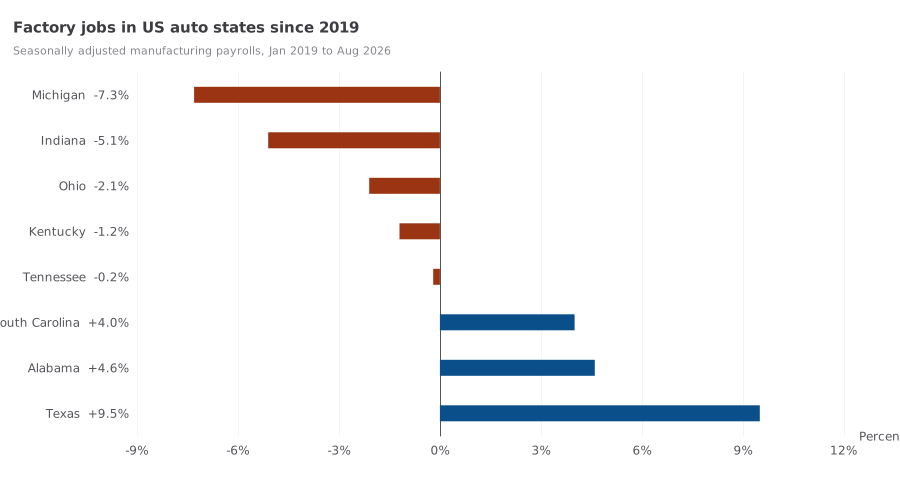
Percent change in seasonally adjusted statewide manufacturing payrolls, January 2019 to August 2026. Manufacturing is broader than motor-vehicle plants. Source: BLS State and Area Employment.
A smaller US factory-job decline, a different industry
A constructed sum of the 50 states and the District of Columbia — each state’s independently seasonally adjusted manufacturing payroll, added together — is 12.776 million in January 2019 and 12.564 million in August 2026, a loss of 212,000 jobs, or 1.7 percent. That sum is not the BLS national manufacturing total, which this dataset does not carry, and adding seasonally adjusted series is not the same as seasonally adjusting a total. It is still a fair reading of whether American factory employment fell on anything like the reported German scale. It did not.
None of this says Volkswagen’s cost problem is imaginary, or that Ifo miscounted German industry. It says the United States did not live the same six years. Auto output here is much higher than in 2019. Factory jobs in the auto states, taken together, are roughly unchanged. Michigan is the closest American echo of the German jobs number, and even there the plants themselves are producing more.
A wage freeze is a labor-cost tool. The American data suggest the competitive pressure, if it exists, is arriving as a productivity and location shift — more vehicles from Texas and the southern transplants, fewer payroll slots in Michigan — not as a missing auto industry.
Sources and methods
This is a retrospective look at a 19 October 2026 news cycle, written on 20 October 2026 from pinned statistical snapshots. It does not reconstruct what was knowable on the news day. Annual GDP is from the BEA GDP-by-state accounts, 30 September 2026 release, in millions of chained 2017 dollars; 2025 is the latest calendar year. Payrolls are BLS SAE statewide seasonally adjusted all-employees, in thousands, from a snapshot whose latest month is August 2026. Motor-vehicle GDP is NAICS 3361–3363, not the broader transportation-equipment sector. State manufacturing jobs include food processors, machinery plants and the rest of the factory sector, not only auto plants. Duplicate not-seasonally-adjusted auto-plant employment series in the same BLS file were left unused. German industry employment and the Volkswagen freeze remain reported news, not verified statistics. Official series: BEA GDP by state, BEA regional methodology, BLS SAE.
Research Date
The displayed date matches the related news edition. Research was completed 2026-10-20.
Related news: Daily · 2026-10-19
More Research
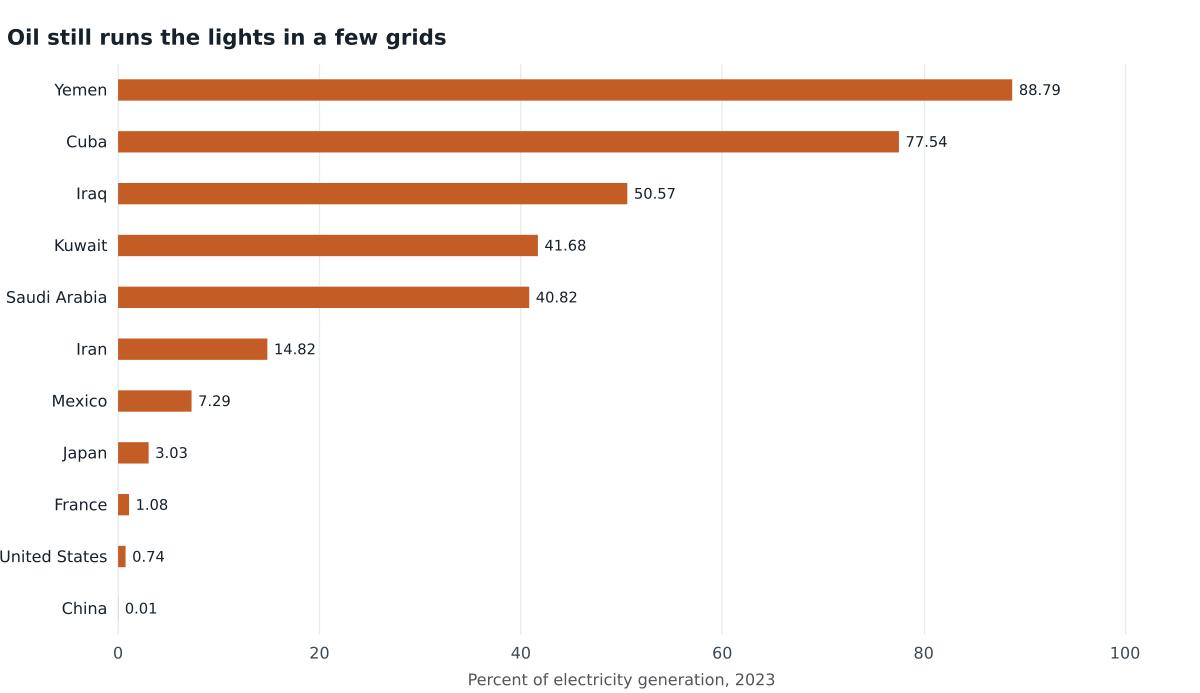
$110 Oil Is A Power-Bill Shock In Only A Few Grids
IRENA accounts show oil-fired electricity falling to 2.4 percent of world generation by 2023, with the remaining kilowatt-hours concentrated in Saudi Arabia, Iraq, Kuwait and Iran.
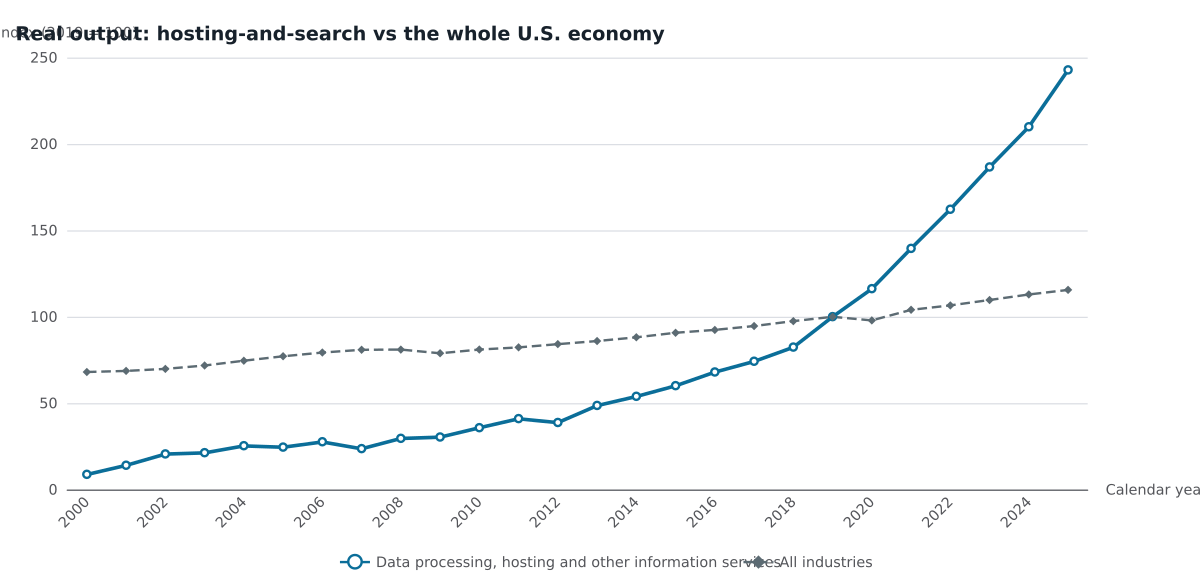
America’s Hosting-And-Search Industry Is Already 2 Percent Of GDP. That Is Not A Map Of Data Center Alley.
BEA accounts show data processing, hosting and internet search already at 1.9 percent of U.S. GDP and about a ninth of 2025 real growth, with value added concentrated in California and Washi
Renewables Caught Fossil Fuels On The Capacity Chart. Fossil Plants Still Set The Generation Record.
IRENA world data show renewable capacity overtaking fossil-fuel capacity in 2025 while fossil electricity generation was still at a record.