LunarWeave
Groceries Cost More. They Still Take A Smaller Slice Of Spending.
Shoppers have spent the past few years clipping coupons, swapping brands and dropping favorite foods. In late July 2026 the Associated Press, citing government price figures, reported that food bought to eat at home had become 33 percent more expensive in U.S. cities since the start of 2019 — after rising only 6.4 percent over the previous seven and a half years. That is a historic jump in the checkout line. It is not, by itself, a verdict on household budgets.
Prices say how much a basket costs. They do not say whether groceries crowded other spending out of American consumption. On that second question, the Bureau of Economic Analysis keeps a quieter ledger: what households actually spent, by category and by state, in current dollars. Through 2024 — the latest year in those state accounts — food bought for home took a smaller share of spending than it did in 2019. Restaurant meals took a larger one.
A bigger grocery bill, a thinner grocery share
BEA’s closest match for the grocery cart is food and nonalcoholic beverages purchased for off-premises consumption: groceries, not restaurant tabs. Americans spent $920 billion on that category in 2019 and $1.25 trillion in 2024, a 35.8 percent increase. Total personal consumption expenditures rose a little faster, 37.8 percent, from $14.4 trillion to $19.9 trillion.
Divide one by the other and the grocery weight in the consumption basket edges down, not up: from 6.37 percent in 2019 to 6.28 percent in 2024. That 2024 share is the lowest in BEA’s 1997–2024 series. In 1997, food at home still accounted for 7.45 percent of spending.
The pandemic briefly reversed the slide. When restaurants closed in 2020, the grocery share jumped to 7.11 percent. It has been falling ever since. By 2024 the spike was gone, and then some.
Per person, the grocery bill still got heavier. Official BEA per-capita spending on food and beverages bought for home — a slightly broader series that also includes alcoholic drinks and a sliver of farm food — rose from $3,280 in 2019 to $4,350 in 2024, up 32.6 percent. Narrowing that to food and nonalcoholic groceries implies about $2,787 per person in 2019 and $3,675 in 2024, up 31.9 percent. Either way, the dollar increase sits close to the 33 percent price rise the AP reported. Households did not, in the aggregate, shrink the grocery cart enough to offset the higher register total. They just spent more on almost everything else, too: per-capita consumption of all goods and services rose 33.8 percent, from $43,720 to $58,499.
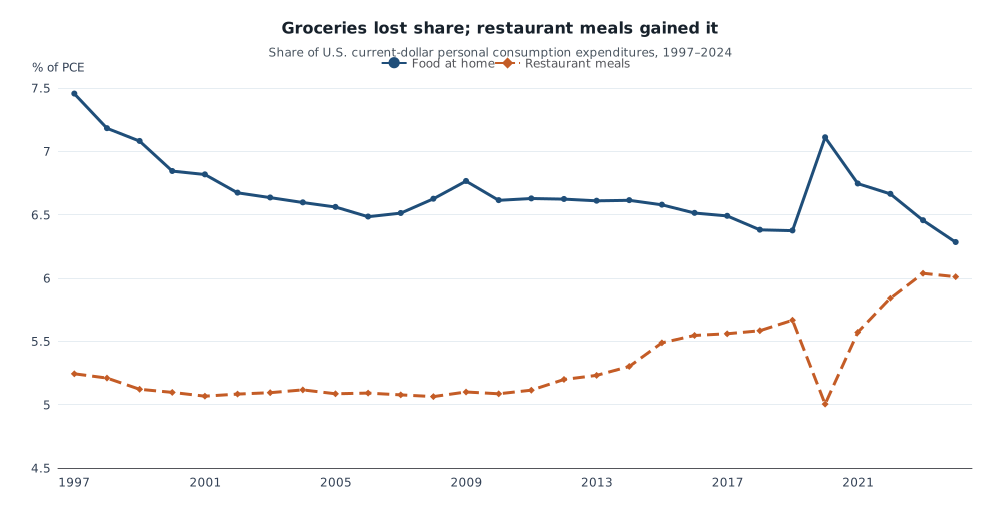
Food and nonalcoholic beverages purchased for off-premises consumption, and purchased meals and beverages, as a share of U.S. current-dollar personal consumption expenditures, 1997–2024. Shares are spending weights, not consumer-price indexes. Source: U.S. Bureau of Economic Analysis, PCE by state.
That is why a historic grocery-price jump can coexist with a record-low grocery share. If the rest of the basket inflates at a similar pace, groceries do not crowd out housing, health care or a night out. They just cost more, along with the rest of life.
Eating out took the extra slice
The category that did gain weight is the one households fled in 2020. Purchased meals and beverages — restaurant food and drink, not the grocery aisle — rose from 5.67 percent of consumption in 2019 to 6.01 percent in 2024, after collapsing to 5.00 percent in 2020. In dollar terms the rebound was sharper still: meal spending jumped 46.2 percent from 2019 to 2024, and 67.9 percent from the 2020 trough.
Put the two food categories together and their combined share of PCE barely moved, from 12.04 percent in 2019 to 12.29 percent in 2024. The mix inside that total flipped. Groceries receded. Dining out advanced. Housing and utilities, a much larger bill, also gained a little ground, from 17.7 percent to 18.1 percent of spending. Health care’s share slipped, from 17.1 percent to 16.7 percent.
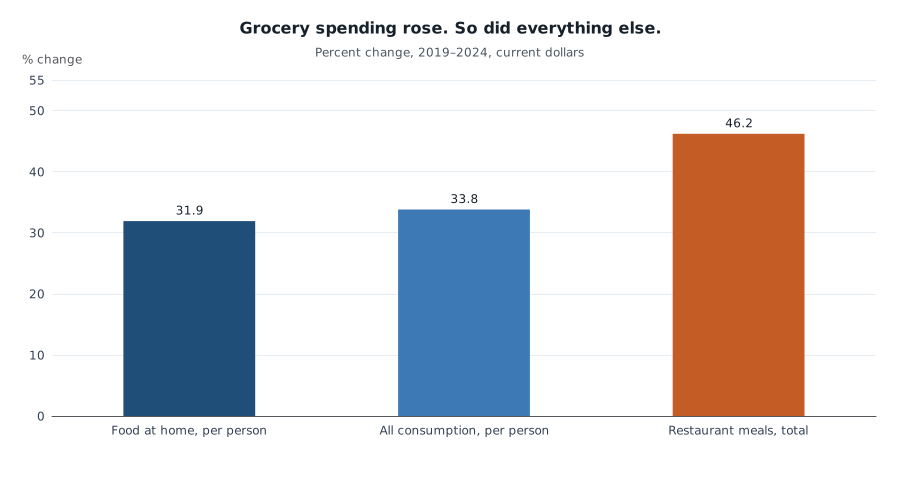
Percent change from 2019 to 2024 in current dollars. Food at home per person is implied as the food-and-nonalcoholic share of PCE times per-capita total PCE. Restaurant meals is the change in aggregate purchased-meals spending. Source: U.S. Bureau of Economic Analysis.
None of this means groceries felt cheap. A third more dollars per person for food at home is a real hit, especially for households that already devote a larger share of spending to food. It means the average consumption basket did not reorganize around the supermarket. The squeeze, such as it was in these accounts, showed up more in the return to restaurants — and in the still-larger housing line — than in groceries elbowing everything else aside.
The bigger gap is between states, not years
National averages hide a more durable inequality. In 2024, food at home took 8.26 percent of consumption in Mississippi and 5.23 percent in Minnesota. That three-percentage-point gap is an order of magnitude larger than the 0.09-point decline in the U.S. grocery share after 2019.
The pattern is not a one-state curiosity. Among the 50 states and the District of Columbia, Mississippi, Kansas, Hawaii, West Virginia, Kentucky, Montana, Maine and Georgia sat at the high end of the grocery share in 2024. Minnesota, Massachusetts, North Dakota, New Jersey, New York, South Dakota, Connecticut and Maryland sat at the low end. In 39 of those 51 areas the grocery share fell between 2019 and 2024. Only 12 saw it rise, and the largest increase — Iowa, up 0.18 percentage points — was tiny next to Idaho’s 0.99-point drop.
Mississippi’s share barely budged (8.27 percent in 2019, 8.26 percent in 2024). Minnesota’s fell from 5.40 percent to 5.23 percent. The geography of the grocery burden, in other words, looks more like a long-standing feature of state consumption than like a 2019–2024 shock.
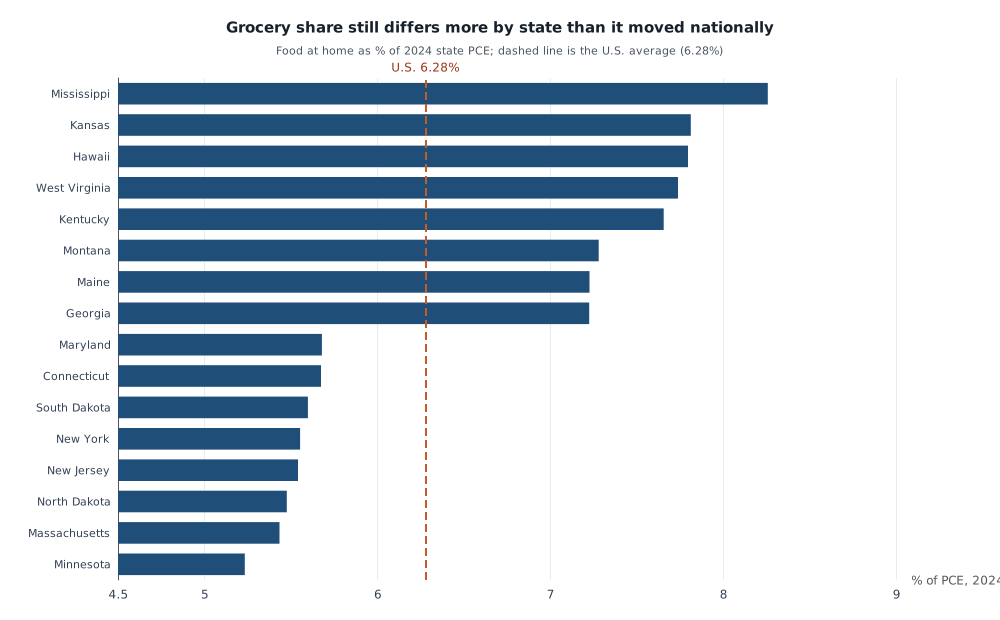
Food and nonalcoholic beverages purchased for off-premises consumption as a share of 2024 state personal consumption expenditures, eight highest and eight lowest states. The dashed line is the U.S. average of 6.28 percent. Source: U.S. Bureau of Economic Analysis.
| Geography | Grocery share, 2019 | Grocery share, 2024 | Change |
|---|---|---|---|
| United States | 6.37% | 6.28% | −0.09 pp |
| Mississippi | 8.27% | 8.26% | −0.01 pp |
| Minnesota | 5.40% | 5.23% | −0.17 pp |
| Idaho (largest decline) | 7.82% | 6.84% | −0.99 pp |
| Iowa (largest increase) | 6.89% | 7.08% | +0.18 pp |
BEA’s state PCE follows households where they live, not where they shop. It is an average across every consumer in the state, so it cannot say how the lowest-income fifth in Mississippi or Minnesota fared. It can say that the places where groceries already claimed more of the basket did not, as a group, see that weight explode after 2019.
What the price story and the spending story each miss
The AP’s 33 percent figure is a price claim for food at home in U.S. cities, attributed to government indexes. This article does not re-estimate that index. BEA spending is a different object: current-dollar outlays, mixing prices and quantities, covering the whole country, and stopping in 2024. A later jump in coffee, tomatoes or chocolate from 2025–2026 tariffs would not appear here.
The two stories can still be read together without forcing them into one number. If city grocery prices rose about a third and national grocery spending per person also rose about a third, the simplest reading is that households paid the higher prices rather than emptying the cart. Because the rest of consumption rose about as fast, groceries did not become a larger slice of the average budget. Restaurant meals did. And the household for whom groceries already take 8 percent of spending, rather than 5 percent, remains in Mississippi, not Minnesota — just as before the spike.
That is colder comfort than a falling price index would be. It is more precise than treating a 33 percent grocery-price rise as proof that food has taken over household budgets.
Sources and methods
This is retrospective research, written on 10 September 2026 about reporting from 25 July 2026, using a later BEA snapshot than would have been available that July. Figures come from BEA’s annual Personal Consumption Expenditures by State (table SAPCE3 in release bea-sapce-2025-09-26), pinned in the research catalogue. “Food at home” is line 27, food and nonalcoholic beverages purchased for off-premises consumption. “Restaurant meals” is line 83, purchased meals and beverages. Totals are line 1. Per-capita food-and-beverages spending is the official SAPCE2 series, which includes alcoholic beverages and food produced and consumed on farms; the narrower per-person grocery figure is implied as the food-and-nonalcoholic share of PCE times official per-capita total PCE.
All values are current dollars, not chain-weighted quantities, and they describe average consumption, not the budgets of low-income households. State results cover 50 states plus the District of Columbia. BEA published these annual figures through 2024; they cannot confirm or refute grocery inflation in 2025 or 2026. The Associated Press price claim is attributed reporting, not a calculation from this dataset.
Research Date
The displayed date matches the related news edition. Research was completed 2026-09-10.
Related news: Daily · 2026-07-25
More Research
Africa’s First Battery Factory Is Plugging Into A Coal Grid
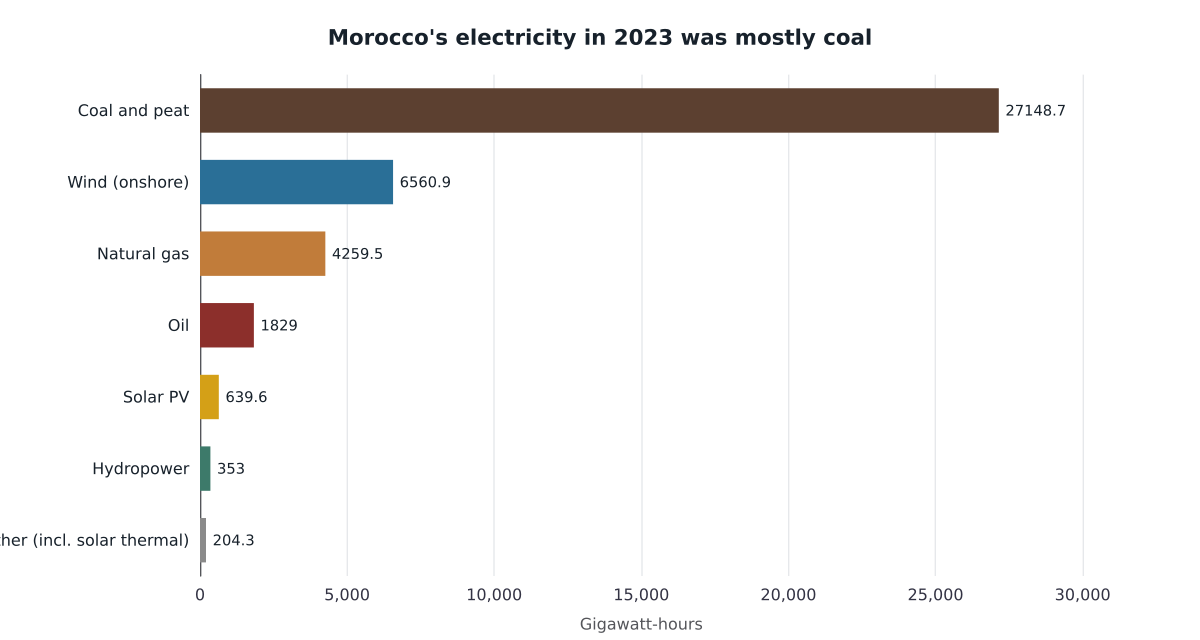
Africa’s first EV battery gigafactory is planned for Morocco, but IRENA data show coal still supplied two-thirds of Moroccan electricity in 2023.
The War Year Cut Palestinian Output By Nearly A Quarter
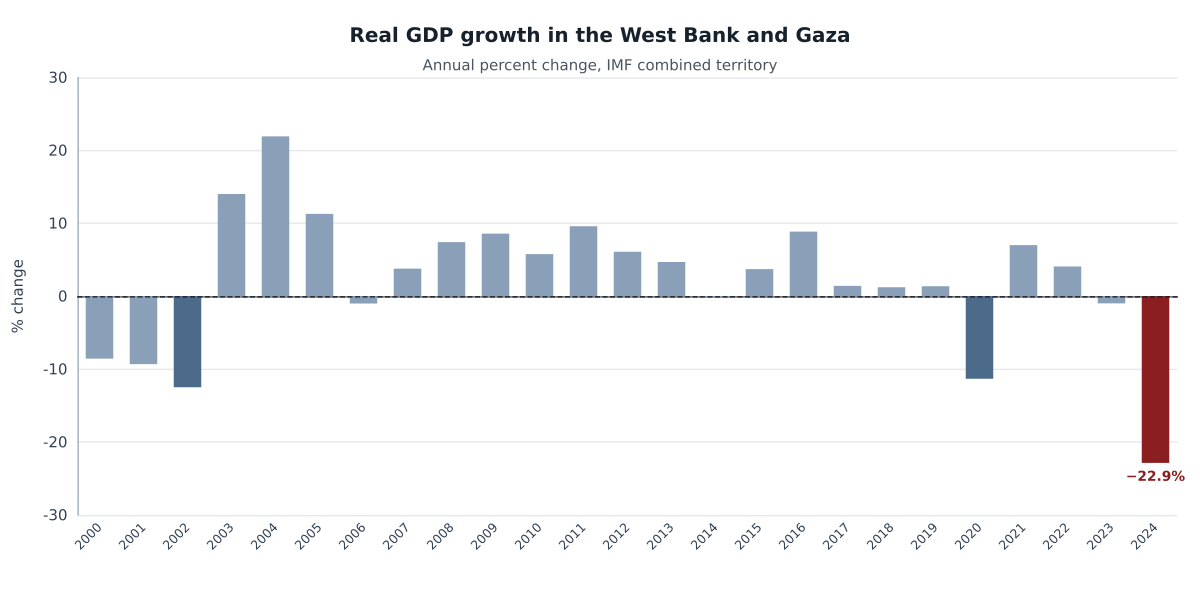
IMF accounts for the combined West Bank and Gaza show a 22.9 percent real-GDP drop in 2024, the worst year in the series, with no published 2025 output path.
Missile Plants Hired. The Shipyards Barely Moved.
US shipyard payrolls have barely grown since 2015, even as missile-and-space plants hired. A look at BLS factory jobs behind the defense-stock boom.